


Risk-Reward Ratio: The Math That Actually Matters


Most traders obsess over being right. They spend hours perfecting entry signals, studying candlestick patterns, and analyzing indicators, all in pursuit of higher win rates. Then they wonder why their account balance keeps shrinking despite correctly predicting market direction more often than not.
The truth is that being right doesn't make you profitable—managing the relationship between what you risk and what you stand to gain does. You can be wrong 60% of the time and still make consistent money, or right 70% of the time and slowly bleed your account dry.
The difference comes down to a simple calculation that most traders either ignore or fundamentally misunderstand.
What Risk-Reward Ratio Actually Measures
The risk-reward ratio isn't about predicting whether a trade will work—it's about measuring whether a trade is worth taking based on what you could lose versus what you could gain. This ratio quantifies trade quality in mathematical terms that remove emotion and wishful thinking from the decision:
-
Risk-reward compares the distance from your entry to your stop loss (the risk) against the distance from your entry to your profit target (the reward)
-
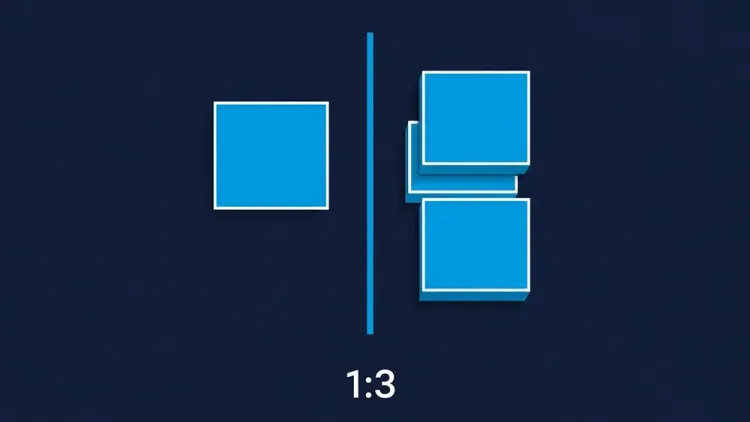
A 1:2 risk-reward means you're risking $1 to potentially make $2, while 1:3 means risking $1 to make $3
-
The ratio exists before you enter the trade and determines whether the setup meets your quality standards
-
Higher ratios mean you need fewer winning trades to be profitable overall
-
Poor ratios mean you need unrealistically high win rates just to break even
Why This Matters More Than Being Right
You can master every candlestick pattern, perfectly identify support and resistance, and develop an instinct for market timing, but if you consistently take trades with poor risk-reward ratios, none of that expertise translates into profits. Pattern recognition tells you when opportunities might exist, but risk-reward ratio tells you which opportunities are actually worth your capital.
A perfect Three Outside Down pattern at resistance means nothing if getting stopped out costs you $500 while your profit target only offers $300. The math doesn't care how confident you feel or how textbook the setup looks. Trading is ultimately a numbers game where your average winner needs to exceed your average loser by enough to compensate for the trades that don't work. Understanding and applying risk-reward ratios transforms trading from gambling on being right into making calculated bets where the math works in your favor over time.
The risk-reward ratio is the filter that separates trades worth taking from trades that look appealing but mathematically guarantee failure—master this concept and you'll finally understand why some traders with mediocre win rates consistently profit while others with impressive accuracy still lose money.
Understanding Risk-Reward Ratio Fundamentals

The risk-reward ratio is simply the relationship between how much you could lose on a trade and how much you could gain. That's it. No complex formulas, no advanced mathematics, just a comparison between two numbers that tells you whether a trade offers favorable terms.
If your stop loss sits $100 below your entry and your profit target sits $200 above your entry, you have a 1:2 risk-reward ratio. You're risking one dollar to potentially make two. This concept applies to every trade you take, whether you consciously calculate it or not.
The difference between successful traders and struggling ones often comes down to whether they measure this ratio before entering trades or ignore it and hope for the best.
How to Calculate Risk-Reward Ratio
The calculation requires three pieces of information: your entry price, your stop loss price, and your profit target price. Once you have these, the math takes seconds:
-
Identify your risk: Subtract your stop loss price from your entry price (for long trades) or subtract your entry price from your stop loss (for shorts). This is your risk per share.
-
Identify your reward: Subtract your entry price from your profit target (for longs) or subtract your profit target from your entry price (for shorts). This is your potential reward per share.
-
Calculate the ratio: Divide your potential reward by your risk. If you're risking $1 to make $3, that's a 1:3 ratio (written as 1:3 or just "3R").
-
Express it simply: A $50 risk with a $150 reward target equals 1:3. A $100 risk with a $200 reward equals 1:2. The first number is always 1 (your risk), the second number shows your reward multiple.
Common Ratios and What They Mean
Different risk-reward ratios have different implications for your trading strategy and the win rate you'll need to achieve profitability. Understanding what each ratio demands helps you set appropriate standards:
-
1:1 ratio: You risk $1 to make $1. Requires winning more than 50% of trades to profit after commissions and fees. Generally considered poor quality.
-
1:2 ratio: You risk $1 to make $2. Need to win 34% of trades to break even, around 40% to be profitable after costs. Solid minimum standard.
-
1:3 ratio: You risk $1 to make $3. Need only 26% win rate to break even, 30-35% to profit. Excellent quality setups that allow room for mistakes.
-
1:4 ratio or higher: You risk $1 to make $4+. Need just 21% wins to break even. Rare but incredibly favorable when market structure allows.
-
Worse than 1:1: You're risking more than you stand to gain. These trades are mathematical suicide regardless of win rate.
Why 50% Win Rate Can Be Profitable
Here's where the math gets interesting and separates traders who understand expectancy from those who just chase accuracy. If you win 50% of your trades with a 1:2 risk-reward ratio, you're profitable. Take ten trades where you risk $100 each. Five trades lose, costing you $500 total. Five trades win at $200 each, earning you $1,000. Net profit: $500, despite being right only half the time.
Now imagine winning 70% of trades but with a 1:1 risk-reward ratio and taking profits early while letting losers run. Seven wins at $100 each equals $700. Three losses at $150 each (because you didn't honor your stop) equals $450. Net profit: $250.
You were right more often but made less money because the math didn't favor you. This is why professional traders focus on risk-reward ratios rather than obsessing over win rate improvement.
The Inverse Relationship Between Win Rate and Risk-Reward
As your risk-reward ratio improves, the win rate required to be profitable decreases proportionally—traders chasing 70% or 80% win rates typically sacrifice risk-reward quality to achieve those numbers, while traders accepting 40-50% win rates can focus on setups offering 1:3 or better ratios where math overwhelmingly favors long-term profitability.
The Bottom Line: The risk-reward ratio and win rate work inversely—better ratios require lower win rates for profitability, meaning you can be wrong more often and still make money consistently, while poor ratios demand unrealistically high accuracy just to break even, explaining why traders focused solely on being right often end up broke despite their impressive win percentages.
Identifying Risk: Where Your Trade Can Go Wrong


Before you can calculate a meaningful risk-reward ratio, you need to know your actual risk on the trade. This sounds obvious, but most traders get it wrong by confusing account risk percentage with trade risk or by underestimating what they're actually putting at stake.
Your risk isn't what you feel comfortable losing or what percentage of your account you've decided to allocate—it's the specific dollar amount between your entry price and your stop loss price, multiplied by your position size.
Getting this number right is the foundation of everything else because if you miscalculate your risk, your entire risk-reward ratio becomes fiction. And fiction doesn't protect your capital when trades go against you.
Defining Risk: Entry to Stop Loss Distance
Risk exists between two points on your chart: where you enter and where you exit if wrong. The distance between these points, multiplied by how many shares or contracts you're trading, equals your risk in dollars. Nothing else factors into this calculation:
IF you enter a stock at $50 with a stop loss at $48, THEN your risk is $2 per share—if you buy 100 shares, you're risking $200 total.
IF you enter at $100 with a stop at $95, THEN your risk is $5 per share regardless of your account size or confidence level.
IF your stop loss is $3 away from entry and you trade 500 shares, THEN your risk is $1,500—this is non-negotiable math, not opinion.
IF you don't place a stop loss at all, THEN your risk is theoretically unlimited, which makes calculating risk-reward ratio impossible.
IF you place a mental stop but don't honor it when hit, THEN your actual risk becomes whatever you eventually lose, destroying your planned ratio.
Why Stop Loss Placement Determines Everything
Your stop loss location determines your risk, which determines your position size, which determines your actual dollar risk, which determines whether the trade meets your risk-reward standards.
Many traders reverse this logic—they decide how many shares they want to buy, then figure out where to place the stop loss based on that position size. This backwards approach leads to stops placed at arbitrary levels that have nothing to do with market structure:
-
A stop placed at a technical invalidation level (below support, above pattern high) reflects where the trade thesis fails
-
A stop placed based on dollar tolerance (I don't want to lose more than $500) ignores whether that level makes technical sense
-
Stops positioned to accommodate your desired position size often get hit by normal volatility because they're too tight
-
The market doesn't care about your risk tolerance—it moves based on supply and demand, hitting stops wherever they sit
-
Proper risk management means accepting that some high-quality setups require wider stops that demand smaller position sizes
Common Risk Calculation Mistakes
DO account for slippage when calculating risk—market orders and volatile conditions mean your stop might fill worse than the price you set.
DO consider gap risk on overnight holds—stocks can open beyond your stop loss, making your actual loss larger than planned.
DO adjust risk calculations for options trades where spreads and time decay affect your real risk.
DON'T assume your stop will fill at exactly the price you set—add 5-10% buffer for realistic risk assessment.
DON'T ignore extended hours volatility if you're holding positions overnight—gaps happen regularly.
DON'T calculate risk using your initial plan if you're moving your stop during the trade—your actual risk is where the stop is now.
Acceptable Risk vs. Actual Risk
Acceptable risk is the amount you're willing to lose on a single trade, typically expressed as a percentage of your account (1-2% is common advice). Actual risk is what you're genuinely putting at stake based on entry, stop loss, and position size.
These numbers need to match, but they're not the same thing. If your account is $50,000 and you want to risk 1% per trade, your acceptable risk is $500. Now look at a specific setup: entry at $100, stop at $95, giving you $5 risk per share. To keep actual risk at $500, you can only trade 100 shares.
The trade's technical requirements (stop location) combined with your risk tolerance (acceptable loss) determines your position size. Traders get into trouble when they:
-
Calculate acceptable risk but then take larger positions because they "really like this setup"
-
Set stops that technically make sense but create actual risk exceeding their acceptable limits
-
Reduce position size appropriately but then move stops when approached, increasing actual risk after entry
-
Use leverage or options that magnify losses beyond their calculated acceptable risk
-
Take multiple correlated positions that create combined actual risk far exceeding intended exposure
Remember: Your risk-reward ratio only means something if the risk component accurately reflects what you'll actually lose when wrong—underestimating risk by ignoring slippage, gaps, or your own tendency to move stops turns your careful calculations into fantasy numbers that provide false confidence instead of genuine trade quality assessment.
Identifying Reward: Where Your Trade Can Go Right


Calculating the reward side of your risk-reward ratio requires honesty about where price can realistically go, not where you hope it will go. Most traders nail the risk calculation because stop losses are concrete and unavoidable, but then completely fabricate the reward side by choosing profit targets based on wishful thinking rather than actual market structure. They see a setup they like and imagine price running to the moon, assigning arbitrary targets that conveniently produce attractive ratios without any technical justification.
This disconnect between planned reward and realistic reward is why so many traders enter with what looks like a 1:3 setup but end up taking profits early at 1:1 when price stalls, or watching their winners reverse into losers because they held for targets that never made sense in the first place.
Setting Realistic Profit Targets Based on Market Structure
Your profit target shouldn't be a number you pull from thin air or a percentage you read somewhere. It needs to be a specific price level where something in the market structure suggests price might pause, reverse, or at least face resistance. The chart tells you where these levels exist if you're willing to look at what's actually there rather than what you want to see. Previous support and resistance zones, trend lines, moving averages,
Fibonacci levels, pattern targets—these all provide objective reference points where price has historically reacted. When you set a profit target at one of these levels, you're acknowledging that buyers or sellers might show up there and interfere with your trade.
This realism keeps you from holding through obvious obstacles hoping for miracles. A profit target at the next resistance level might only offer a 1:1.5 ratio, but if that's where the chart says price will likely stall, then that's your realistic reward. You can either accept the ratio or skip the trade, but you can't just move your target higher to manufacture a better ratio while ignoring the resistance that will actually stop your trade.
Support and Resistance as Natural Profit Zones
Quick Tip: Identify the nearest significant support level (for shorts) or resistance level (for longs) after your entry—this is where opposing traders will likely defend, making it a logical place to take profits or at least partial profits.
Quick Tip: Previous swing highs and lows create natural target zones because these levels proved important before and traders remember them, creating self-fulfilling reactions when price returns.
Quick Tip: Round numbers (like $50, $100, $150) attract psychological interest and limit orders, making them reasonable profit targets even without other technical confluence.
Quick Tip: When multiple technical factors converge at one price level—resistance plus a Fibonacci level plus a moving average—that confluence zone makes an especially strong candidate for your profit target.
Quick Tip: If the nearest logical target doesn't provide adequate risk-reward ratio, the trade might not be worth taking rather than manufacturing a better ratio by ignoring obvious obstacles.
Measured Moves and Pattern-Based Targets
Pattern-based profit targets use the pattern's structure to project where price might travel. These methods work because they're rooted in the actual price movement that created the pattern rather than arbitrary percentages:
-
Measure the height of a flag or channel, then project that distance in the breakout direction
-
Calculate the distance from a pattern's low to high and add (or subtract) that to the breakout point
-
Use the first impulse move's size to estimate the next leg's potential after consolidation
-
Project support/resistance levels by extending previous ranges forward
-
Combine pattern targets with nearby support/resistance to validate whether the projected target is realistic or conflicts with obvious obstacles
Why Wishful Thinking Destroys Your Ratios
Here's how most traders sabotage their risk-reward calculations: they find a setup with a technically sound stop loss location that happens to be close to their entry, creating unavoidable risk of $1 per share. Then they look for a profit target and realize the nearest resistance is only $1.50 away, producing an underwhelming 1:1.5 ratio.
Rather than accepting this reality or skipping the trade, they simply move their target to $3 away because "the trend is strong and could definitely go there." Now they've manufactured a 1:3 ratio on paper that lets them justify taking the trade.
The problem arrives when price hits that $1.50 resistance and stalls exactly where technical analysis said it would. Now they face a choice: take profits at 1:1.5 (admitting the original ratio was fiction) or hold for the manufactured $3 target and watch their winner reverse into a loser. This is how traders with "excellent risk-reward discipline" somehow end up with losing accounts.
The ratio you calculate means nothing if the reward target isn't actually achievable. Better to pass on a trade with a mediocre but honest ratio than take one with a fantastic but fabricated ratio that never had a chance of working.
Calculating and Applying Risk-Reward Ratios


The actual calculation takes about thirty seconds once you have your entry, stop, and target identified. What takes longer is the discipline to do this calculation before every trade and then actually respect what the math tells you.
Most traders skip this step entirely, convinced they can eyeball whether a trade is worth taking, or they calculate the ratio after they've already decided to enter as a form of post-hoc justification. Neither approach works.
The risk-reward ratio is a filter that should keep you out of marginal trades, but it only functions as a filter if you use it before committing capital. Here's the process that turns this concept from theory into something that actually protects and grows your account:
-
Identify your entry price based on your technical analysis, pattern recognition, or trading signal
-
Determine your stop loss location based on where the trade thesis becomes invalid (pattern break, support loss, resistance reclaim)
-
Calculate your per-share or per-contract risk by subtracting your stop from your entry (or vice versa for shorts)
-
Identify your profit target based on the next significant support or resistance level, measured move, or pattern-based projection
-
Calculate your per-share or per-contract reward by subtracting your entry from your target (or vice versa for shorts)
-
Divide reward by risk to get your ratio (if you're risking $2 to make $6, that's 6÷2 = 3, expressed as 1:3)
-
Compare this ratio to your minimum acceptable standard before deciding whether to take the trade
Minimum Acceptable Ratios for Different Trading Styles
What qualifies as an acceptable risk-reward ratio depends on your trading approach, typical win rate, and how frequently you trade. More active traders with higher win rates can accept tighter ratios, while swing traders taking fewer high-quality setups should demand better ratios:
-
Scalpers and day traders: Might accept 1:1.5 or better because they take many trades and often achieve 55-65% win rates through tight management and quick decisions
-
Swing traders: Should target 1:2 minimum, preferably 1:3, because trades take longer to develop and fewer opportunities mean each one needs to count more
-
Position traders: Can afford to wait for 1:3 or better since they're taking very few trades and need each winner to substantially outweigh losers
-
Pattern traders: Should base minimum ratios on pattern reliability—high-probability patterns (75%+ success) can work at 1:2, while lower-probability patterns (50-65%) need 1:3 or better to compensate
-
Universal standard: Anything worse than 1:1.5 should be automatically rejected regardless of how compelling the setup appears
Adjusting Position Size When Risk-Reward Is Unfavorable
Sometimes you'll find a setup that meets most of your criteria but the risk-reward ratio falls short of your standards. Rather than skipping it entirely or lowering your standards, you can adjust your position size to reflect reduced confidence:
-
If your standard trade risks 2% of your account with 1:3 setups, drop to 1% risk on 1:2 setups to maintain similar expectancy
-
Calculate position size by dividing your acceptable dollar risk by your per-share risk—if you'll risk $500 and the stop is $5 away, trade only 100 shares
-
Consider taking partial positions on marginal ratios, then adding if the trade moves in your favor and ratio improves with a trailing stop
-
Never increase position size to compensate for poor ratios—risking 4% on a 1:1 trade doesn't make it equivalent to risking 2% on a 1:2 trade
-
Use reduced sizing as a compromise between taking every setup and being too selective, allowing you to participate while managing exposure appropriately
When to Skip Trades That Don't Meet Your Standards
The hardest part of applying risk-reward ratios isn't calculating them—it's walking away from trades that fail to meet your requirements even when everything else looks perfect. You'll find setups where the pattern is textbook, the entry looks clean, and your conviction is high, but the math just doesn't work.
Maybe resistance sits too close to entry, or the stop needs to be too wide for the available reward. Skipping these trades feels like missing opportunities, but it's actually avoiding mathematical traps:
-
If the nearest logical target creates a ratio below your minimum standard, skip the trade regardless of other factors
-
When you need to move your target beyond obvious resistance to manufacture an acceptable ratio, skip the trade—the ratio is fake
-
If the stop location that makes technical sense creates a ratio worse than your standard, skip the trade rather than using a tighter stop that will likely fail
-
When every adjustment you consider (tighter stop, farther target, bigger position) requires breaking your other rules to make the ratio work, skip the trade
-
If you're trying to justify why "this specific setup is different" and deserves an exception to your ratio requirements, skip the trade—exceptions become habits
Think of it this way: your risk-reward ratio requirement is like a bouncer at an exclusive club—it doesn't matter how good-looking the trade is or how many friends it has, if it doesn't meet the minimum standard, it doesn't get in, because letting in one trade that fails your standards makes it easier to let in the next one until you've abandoned standards entirely and wonder why your account is shrinking despite all your "great" setups.
The Win Rate Connection

Win rate and risk-reward ratio are two sides of the same profitability equation, and understanding how they interact determines whether you make money or slowly bleed your account. You can't evaluate one without considering the other—a 70% win rate sounds impressive until you realize you're taking profits at 1:0.5 ratios while letting losers run, and a 40% win rate sounds terrible until you see you're capturing 1:4 ratios on winners.
Most traders fixate on improving their win rate because being right feels good and validates their analysis, but this obsession usually destroys their risk-reward discipline. They start taking profits too early to lock in wins, moving stops to avoid losses, and choosing setups based on high probability rather than favorable reward potential. The result is an impressive winning percentage attached to a declining account balance, proving once again that feeling right and being profitable are completely different things.
-
A 33% win rate with consistent 1:3 ratios produces the same profit as a 50% win rate with 1:1.5 ratios—fewer wins, better ratios, same result
-
Traders with 60% win rates and 1:2 ratios outperform traders with 45% win rates and 1:3 ratios, but both are profitable while 75% wins at 1:0.8 ratios loses money
-
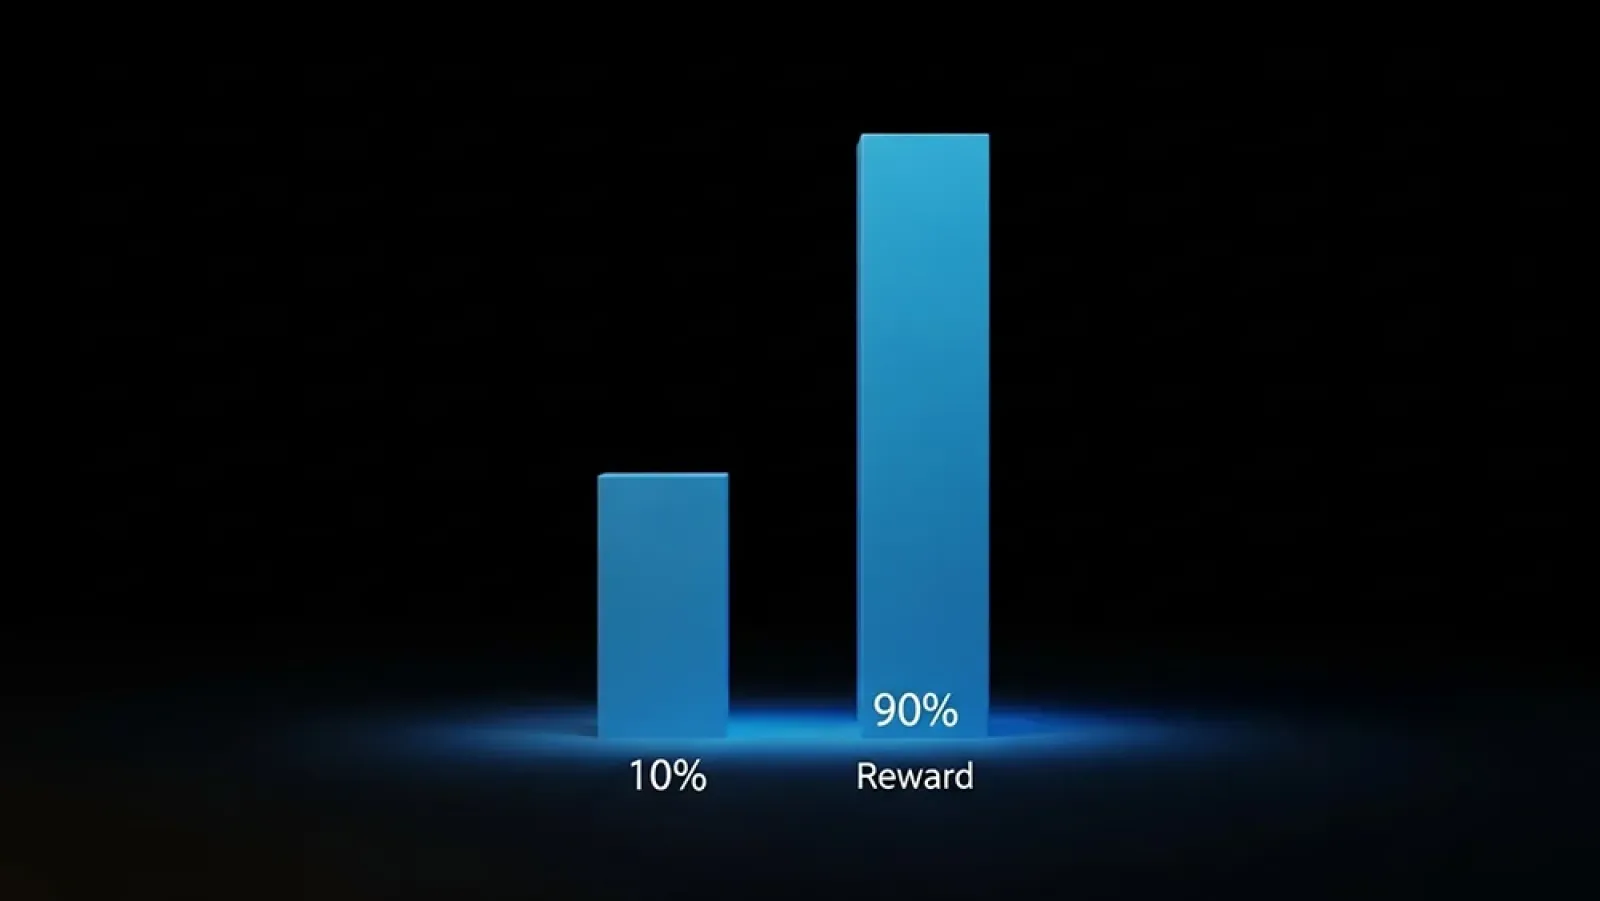
Your break-even win rate drops as your risk-reward ratio improves—at 1:1 you need 50% wins, at 1:2 you need 34%, at 1:3 you need only 26%
-
The combination of win rate and ratio creates your expectancy—the average amount you make per trade over time
-
Focus on the wrong metric (win rate vs. ratio) and you'll optimize yourself into unprofitability despite working harder
Break-Even Win Rates and Why They Matter
Pro Tip: Calculate your break-even win rate using this formula: 1 ÷ (1 + Risk-Reward Ratio). For a 1:2 ratio, that's 1 ÷ (1 + 2) = 33.3% break-even rate.
Pro Tip: Your actual win rate needs to exceed break-even by enough to cover commissions and slippage—aim for at least 5-10 percentage points above break-even to be genuinely profitable.
Pro Tip: Track both your average win rate and average risk-reward ratio monthly to ensure they're working together to create positive expectancy rather than canceling each other out.
Pro Tip: If your win rate is significantly higher than required for your ratios, you might be exiting winners too early—consider holding longer to capture more of the available reward.
Pro Tip: If your win rate is barely above break-even despite good planned ratios, you're probably not honoring your stops or taking profits prematurely, destroying your actual ratios.
Why Chasing High Win Rates Destroys Risk-Reward
Quick Tip: High win rate strategies typically require taking profits quickly and cutting losses slowly—the exact opposite of profitable trading.
Quick Tip: Traders who brag about 80% win rates usually have terrible risk-reward ratios because they're banking small winners and taking large occasional losses.
Quick Tip: The easier a pattern is to identify and trade, the tighter the stops need to be and the smaller the targets become, reducing reward potential for higher accuracy.
Quick Tip: Chasing win rate improvement often means trading more frequently and taking lower-quality setups just to pad the statistics, increasing costs and reducing edge.
Quick Tip: Focus on risk-reward first and let win rate fall where it naturally lands—if you're capturing good ratios consistently, you can be profitable at 40-45% accuracy.
The Math That Changes Everything
Here's the uncomfortable mathematical reality: a trader with a 35% win rate and consistent 1:3 risk-reward ratios makes more money than a trader with a 65% win rate and 1:1 ratios. Take 100 trades risking $100 each. Trader A wins 35 times at $300 each ($10,500) and loses 65 times at $100 each ($6,500) for a net profit of $4,000. Trader B wins 65 times at $100 each ($6,500) and loses 35 times at $100 each ($3,500) for a net profit of $3,000. Despite being right nearly twice as often, Trader B makes 25% less money.
This is why professional traders focus on finding setups with favorable risk-reward ratios and accept that they'll be wrong frequently, while amateur traders chase win rate improvements and wonder why success feels so difficult despite all their correct predictions.
Common Mistakes and Misconceptions


Understanding risk-reward ratios in theory is straightforward—the problems emerge when emotions, hope, and poor habits interfere with actually applying what you know. Traders make the same predictable mistakes with risk-reward calculations, not because they don't understand the math, but because they let other factors override discipline when it matters.
These errors typically stem from wanting to take a trade so badly that you'll manipulate the numbers to justify it, or from refusing to do the work upfront because calculating ratios feels tedious compared to just clicking the buy button.
The result is traders who talk about risk-reward but consistently take trades that violate their stated standards, then wonder why their results don't match their understanding.
-
Moving stops after entry to improve risk-reward: You see the ratio doesn't meet your standards so you move the stop closer to entry, creating a better ratio on paper but placing the stop at a technical level that has no validity and will likely get hit by normal volatility, turning theoretical improvement into guaranteed failure
-
Choosing arbitrary profit targets: Rather than identifying the next resistance level or technical obstacle, you pick a target that produces an attractive ratio regardless of whether anything in the market structure suggests price will actually reach that level before reversing
-
Ignoring risk-reward on compelling setups: The pattern looks perfect, your conviction is high, and you convince yourself that "this one is different" so the ratio doesn't matter as much, leading you to take trades with 1:1 or worse ratios that you'd normally reject
-
Calculating ratios after entering: You spot a setup, enter immediately based on pattern or indicator, then calculate the risk-reward afterward to see if it was any good, which serves no purpose since you're already in the trade and the information can't change your decision
-
Confusing account risk with trade risk-reward: You think "I'm risking 2% of my account" means you have good risk-reward, not realizing that account risk percentage and the trade's risk-reward ratio are completely different measurements that address different aspects of position management
-
Setting targets based on desired profit: You want to make $1,000 on this trade so you set a target that produces that profit with your position size, ignoring whether the chart suggests price can realistically reach that level
-
Using the same ratio for all trades: You've read that 1:3 is good so you force every trade to fit a 1:3 ratio by adjusting stops or targets artificially, rather than letting market structure determine what ratio is actually available
-
Assuming higher ratios are always better: You pass on a valid 1:2 setup with a high-probability pattern at support, waiting for a 1:4 setup that never materializes or requires such a wide stop that you can't size the position appropriately
Why These Mistakes Keep Happening
These errors persist because they all serve the same psychological function—they let you take trades you want to take regardless of whether the math supports them. Moving a stop or choosing an arbitrary target transforms a marginal setup into one that meets your standards on paper, which feels better than admitting the trade doesn't qualify and walking away.
The truth is that most traders understand risk-reward ratio concepts perfectly well but struggle with the discipline to actually let those concepts filter their trading decisions. You know you should calculate ratios before entering, but the setup looks so good that pausing to do the math might mean missing it. You know your stop should go where invalidation occurs, but that creates a ratio below your standards, so you tighten it and tell yourself you're being disciplined about risk management.
The solution isn't learning more about risk-reward ratios—you already know enough. The solution is developing the honesty to recognize when you're manipulating numbers to justify trades and the discipline to skip those trades instead of taking them with fabricated ratios that guarantee mathematical failure over time.
Improving Your Risk-Reward Selection


Finding trades with favorable risk-reward ratios isn't about getting lucky or having some special talent for picking winners—it's about developing systematic habits that naturally filter for quality setups before you even consider entering. Most traders do this backwards, finding a stock or pattern they like and then trying to force a good ratio out of it.
Better traders scan specifically for situations where market structure creates natural asymmetry between risk and reward, then evaluate whether the setup meets their other criteria. This approach means you're starting with math that works in your favor rather than hoping you can manufacture it after falling in love with a chart.
Small changes in how you search for trades, when you're willing to enter, and what standards you enforce can dramatically improve the average quality of setups you take without requiring any additional technical skill or market knowledge.
-
Scan for stocks near clear support or resistance levels: These create natural stop loss locations close to entry with meaningful profit potential to the next technical level, automatically improving your available ratios compared to stocks in the middle of ranges
-
Use multiple timeframes to refine entries: A weekly chart might show a great setup, but zooming to daily or hourly can reveal better entry points on pullbacks that tighten your stop while maintaining the same target, turning a 1:2 into a 1:3
-
Wait for pullbacks in trending markets: Rather than chasing breakouts where stops are wide and targets are uncertain, let price retrace to support in uptrends or resistance in downtrends, offering tighter risk with the trend's momentum behind your target
-
Identify where tight stops actually make sense: A stop just below recent consolidation in a strong trend provides valid risk management, but a tight stop in choppy conditions just gets hit by noise—context determines whether tight stops improve or destroy your ratios
-
Set alerts at key levels rather than entering immediately: When you spot potential setups, set alerts for when price reaches your ideal entry zone instead of entering at current prices where ratio might be mediocre
-
Build a pre-trade checklist that includes ratio minimums: Before entering any trade, verify it meets your risk-reward standard along with pattern quality, trend alignment, and volume confirmation—ratios are required, not optional
-
Track which market conditions produce your best ratios: Review past trades to identify whether breakouts, pullbacks, reversal patterns, or continuation setups consistently offer better ratios for your style, then focus on those scenarios
-
Accept that fewer trades with better ratios beats more trades with mediocre ratios: Quality over quantity applies to risk-reward just like everything else in trading—taking three 1:3 setups monthly outperforms taking fifteen 1:1.5 setups
Building Systematic Quality Assessment
Improving your risk-reward ratio selection ultimately comes down to building a systematic framework that you apply to every potential trade before committing capital. This isn't about becoming more selective to the point of paralysis—it's about knowing exactly what you're looking for and passing quickly on trades that don't meet those standards while jumping on the ones that do.
Start by identifying your non-negotiable minimum ratio based on your win rate and trading style, then refuse to take anything that doesn't meet it regardless of how compelling other aspects of the setup appear.
Next, develop the habit of checking multiple timeframes for every trade, looking for ways to improve entry timing even by a few ticks since small improvements in entry can dramatically shift risk-reward ratios when stops are relatively tight. Learn to recognize when market structure naturally creates favorable asymmetry—stocks pulling back to moving average support in strong uptrends, breakouts with tight consolidation offering close stops, or reversals at major resistance where targets are clear.
The traders who consistently find excellent risk-reward ratios aren't smarter or more experienced, they're just more disciplined about searching in places where good ratios naturally exist and walking away from everywhere else, no matter how tempting the setup looks if you ignore the math.
Tracking and Measuring Your Results
Planning good risk-reward ratios means nothing if you don't actually capture them in real trades. The gap between intended ratios and realized ratios reveals everything about your discipline, emotional control, and whether your trading plan survives contact with live markets. Most traders calculate beautiful 1:3 ratios before entering, then take profits early at 1:1 when price moves in their favor, or move stops and turn planned 1:2 setups into actual 1:0.5 disasters when trades move against them.
Without tracking what actually happens versus what you planned, you'll never know whether your problem is finding good setups or executing them properly. The numbers don't lie, and reviewing your actual performance data forces you to confront uncomfortable truths about where theory meets reality in your trading.
-
Track your planned risk-reward ratio at entry: Record what ratio you calculated before entering each trade based on your entry, stop, and target
-
Track your actual realized ratio at exit: Record what ratio you actually captured based on where you entered and where you exited, whether at your target, stop, or somewhere else
-
Calculate the difference between planned and realized ratios: If you consistently plan 1:3 but realize 1:1.5, you have an execution problem not a setup selection problem
-
Measure your average realized ratio on winning trades specifically: This reveals whether you're letting winners run to targets or cutting them short when they move in your favor
-
Track how often you honor your original stop vs. moving it: Stops moved wider destroy your planned ratios and usually precede larger losses
-
Document why you exited early when you do: "Took profits because I got nervous" is different from "exited at resistance that emerged after entry" and requires different solutions
-
Review this data monthly to identify patterns: Are you better at holding shorts than longs? Do you exit winners early in the morning but hold afternoon trades? Patterns reveal psychological weaknesses
The Planned vs. Realized Ratio Gap
Here's what typically happens: you enter a trade with a planned 1:3 risk-reward ratio, feeling disciplined and mathematical. Price moves in your favor and you're up 1:1. Then doubt creeps in—what if it reverses? You take profits, banking the win. Your actual realized ratio was 1:1, not 1:3. Do this consistently and your win rate might be 55%, but your average winner is barely larger than your average loser, making you marginally profitable at best despite seemingly good planning. The planned ratio showed you what was possible. The realized ratio shows you what you actually did. This gap is where most trading improvement lives.
How Emotional Exits Destroy Your Ratios
Emotional decision-making during trades demolishes carefully planned risk-reward ratios faster than any other factor. The discipline you had while analyzing the setup evaporates once real money is moving:
-
Fear of giving back profits: You're up 1:1.5 on a planned 1:3 trade, so you exit "to lock in gains" because you're scared of watching it reverse
-
Panic on drawdown: Your trade moves against you but hasn't hit your stop, so you exit manually to avoid further losses, turning a planned 1:2 into an actual 1:0.3
-
Moving stops to avoid losses: Your stop is about to get hit, so you move it wider to give the trade "more room," destroying your planned ratio and usually making the eventual loss much worse
-
Target moving based on greed: You hit your profit target but the stock is still moving, so you cancel the order and hold for more, watching your 1:3 winner reverse into a 1:1 or even a loss
-
Trading without stops because "you're watching it": You skip placing a hard stop, planning to exit mentally, then freeze when the trade goes against you and take losses well beyond your planned risk
Using Data to Build Better Discipline
Your trade journal becomes most valuable when you use it to analyze the gap between what you planned and what you executed. Each month, calculate your average planned risk-reward ratio across all trades you entered. Then calculate your average realized risk-reward ratio across those same trades.
If planned averages 1:2.8 but realized averages 1:1.4, you're cutting winners in half, which means you need almost double your planned win rate to achieve the same profitability. This data tells you where to focus improvement efforts. If you're consistently planning good ratios and realizing them, your issue might be win rate or trade frequency.
If you're planning good ratios but realizing terrible ones, your issue is execution and emotional control, not analysis. Review trades where planned and realized ratios differ most dramatically—these outliers often reveal your biggest psychological weaknesses. Maybe you hold losing oil trades too long but exit winning tech trades too early. Maybe you're disciplined in the morning but emotional in the afternoon.
The patterns in your data show you exactly where your discipline breaks down, giving you specific areas to work on rather than vague goals like "be more disciplined."
Track long enough and you'll either see improvement in your realized ratios approaching your planned ones, or you'll realize your planned ratios were never realistic and need adjustment, but either way the data forces honesty about what's actually happening in your trading.
Risk-Reward Ratio: The Filter That Protects Your Capital


The risk-reward ratio isn't just another metric to track alongside dozens of others—it's the primary filter that should determine which trades you take and which you skip. Understanding this concept transforms trading from emotional gambling into mathematical decision-making where you know exactly what you're risking, what you stand to gain, and whether those numbers justify putting your capital at stake.
Most traders will read this, nod along, and then continue taking trades based on how compelling the setup looks or how confident they feel, completely ignoring the math until they're reviewing losses and wondering what went wrong.
The difference between traders who consistently profit and those who struggle isn't pattern recognition skill or market knowledge—it's the discipline to actually use risk-reward ratios as the non-negotiable standard they're supposed to be rather than a suggestion you consider when convenient.
-
Trade quality beats trade frequency every time—three carefully selected 1:3 setups monthly outperform fifteen mediocre 1:1.2 setups
-
Your risk-reward ratio requirement acts as a bouncer keeping bad trades out of your account, but only if you actually enforce it
-
Being right means nothing without favorable ratios—70% accuracy with poor ratios loses money while 40% accuracy with strong ratios profits
-
Calculate ratios before entering every trade, not after, and walk away from anything that doesn't meet your minimum standard
-
Track your realized ratios versus planned ratios to identify whether your problem is finding good setups or executing them properly
-
The math determines profitability over time—win rate, average winner, average loser, and frequency all combine into your expectancy
-
Accept that enforcing ratio standards means missing trades that work out, but taking trades that don't meet standards guarantees long-term failure
The Discipline Most Traders Lack
The hardest part of using risk-reward ratios isn't understanding them—you probably understood the concept within the first two sections of this article. The hard part is actually skipping trades that fail to meet your standards when everything else about the setup looks perfect. You'll see textbook patterns at ideal locations with strong volume confirmation, feel completely confident about the direction, and then calculate a 1:1.3 ratio that falls short of your 1:2 minimum.
Letting that trade go feels impossible. You'll rationalize why this specific setup is different, why the ratio doesn't matter as much this time, why you should make an exception. This is where discipline either exists or doesn't.
Professional traders pass on these setups without much internal debate because they've internalized that math beats feeling every time. Amateur traders convince themselves that conviction can compensate for poor ratios, then wonder why their results never improve despite all their effort and analysis.
The Bottom Line: Risk-reward ratio is the difference between trading as educated gambling and trading as mathematical business—calculate it before every trade, enforce your minimum standards without exception, track your realized ratios against planned ones, and accept that skipping trades with poor ratios keeps more money in your account than taking them ever will, regardless of how many of those skipped trades would have worked out in your favor.
