


The Pennant Pattern: When Momentum Takes a Breath


Most continuation patterns promise to identify brief pauses in strong trends before price resumes its original direction. The reality is that most of these patterns fail more often than they succeed, trapping traders who assume consolidation always leads to continuation. Pennants are different. When identified correctly with proper structure and volume characteristics, they offer some of the highest-probability continuation setups in technical analysis.
The reason comes down to what pennants actually represent—genuine rest periods in powerful trends rather than exhaustion or reversal warnings. Strong moves create pennants when early participants take profits while new participants hesitate, creating temporary equilibrium that resolves in the original direction once momentum rebuilds.
What the Pennant Pattern Shows You
The pennant pattern is a small symmetrical triangle that forms immediately after a sharp, nearly vertical price move. This consolidation represents the market catching its breath before the next leg:
-
A strong directional move (the flagpole) creates the initial momentum
-
Brief consolidation with converging highs and lows forms the pennant shape
-
The pattern typically completes in one to three weeks on daily charts
-
Volume declines during consolidation as participants wait for direction
-
Breakout from the pennant usually resumes the original trend direction
Why Trend Traders Need This Pattern
Traders who successfully catch initial trend moves face a common problem—when and where to add to winning positions without chasing or buying tops. The pennant pattern solves this by identifying specific zones where adding to positions makes mathematical and psychological sense.
The pattern appears after you've already captured part of a move, giving you a second entry opportunity at better risk-reward than chasing the current price. While others are uncertain whether the move will continue or reverse, the pennant structure tells you the trend is pausing, not ending.
Institutional traders use these consolidations to accumulate additional positions, and the pennant formation reveals when that accumulation is complete and the next leg is ready to begin.
The Bottom Line: The pennant pattern succeeds where other continuation patterns fail because it forms only after genuinely strong moves and completes quickly before the underlying trend loses momentum—giving trend traders high-probability opportunities to add positions during brief pauses rather than chasing price or guessing when pullbacks will end.
Understanding the Pennant Pattern Structure
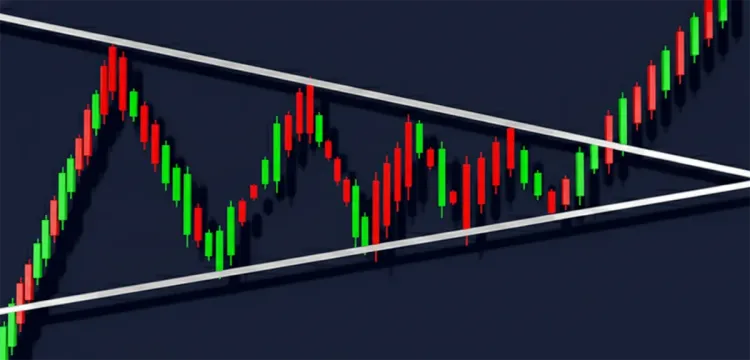

The pennant pattern consists of two distinct parts that must both be present for the pattern to be valid. First comes the flagpole—a sharp, nearly vertical price move in one direction showing strong momentum. Then comes the pennant itself—a small symmetrical triangle where price consolidates with converging trendlines as buyers and sellers reach temporary equilibrium.
Without both components, you don't have a pennant. A triangle without a preceding strong move is just a triangle. A sharp move without consolidation is just momentum that may or may not continue. The combination of these two elements creates the pattern's predictive power.
The Flagpole: The Setup Move
The flagpole is the initial sharp price move that precedes the pennant consolidation. This move establishes the momentum that the pattern will eventually continue:
-
The move should be nearly vertical or at a steep angle, not a gradual climb or decline
-
Price typically moves 10-20% or more in a short period (days to weeks depending on timeframe)
-
Volume should be strong during the flagpole formation, confirming real momentum
-
The move often occurs on a breakout from another pattern or significant level
-
Weak or choppy moves don't create valid pennants—strength matters
The Pennant: Consolidation with Converging Lines
The pennant itself is the consolidation phase where price forms a small symmetrical triangle. This structure shows the market is pausing, not reversing:
-
Both an upper trendline connecting lower highs and a lower trendline connecting higher lows must form
-
The lines converge toward each other, creating a symmetrical triangle or pennant shape
-
The consolidation range is typically small relative to the preceding flagpole move
-
Price bounces between the converging trendlines at least twice on each side
-
The pennant should remain relatively horizontal, not tilting sharply up or down
Time Requirements and Visual Distinctions
Pennants form and complete quickly compared to other continuation patterns. On daily charts, valid pennants typically form over one to three weeks—long enough to establish the consolidation structure but short enough that the underlying momentum doesn't dissipate.
Pennants that take longer than four weeks often fail because the original momentum has faded. What distinguishes pennants from other patterns is the combination of sharp preceding move, small consolidation range relative to that move, and symmetrical converging trendlines.
Flags have parallel boundaries rather than converging ones. Wedges tilt noticeably in one direction. Regular triangles form over longer periods without the sharp flagpole. The pennant's compact, symmetrical structure following vertical movement makes it visually distinct once you know what to look for.
The pennant pattern's structure—a near-vertical flagpole followed by brief symmetrical consolidation—creates its reliability because the pattern only forms when genuine momentum exists and completes quickly before that momentum can fade, giving traders a clear visual signal that the pause is temporary rather than the beginning of reversal or extended consolidation.
Bullish Pennant Formation
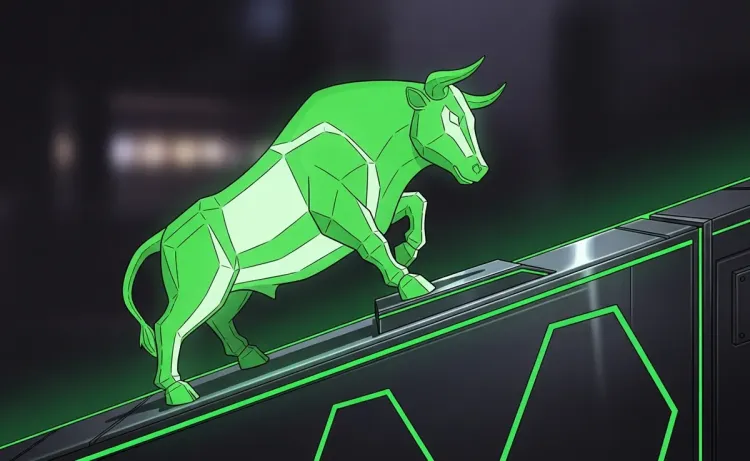

A bullish pennant forms when price rallies sharply upward, creating a steep flagpole, then consolidates in a small symmetrical triangle before breaking out to continue higher. The pattern signals that the uptrend is pausing for rest rather than ending, giving traders who missed the initial move a second chance to enter before the next leg up.
Valid bullish pennants require specific structural elements that separate genuine continuation setups from random consolidation that might resolve in either direction. Without these elements, you're just looking at a triangle that could break down as easily as it breaks up.
Requirements for Valid Bullish Pennants
The upward flagpole must demonstrate genuine bullish momentum before the consolidation can be trusted as a continuation signal:
-
The rally should be steep, ideally at 45 degrees or sharper, showing strong buying pressure
-
Price typically moves 15-30% or more in a matter of days to weeks depending on timeframe
-
Volume should expand during the flagpole rally, confirming institutional participation
-
The move often begins from a breakout, support level, or other technically significant point
-
Weak grinding rallies or choppy upward movements don't create valid pennant patterns
Consolidation and Volume Signals
IF the pennant forms with converging trendlines where highs get lower and lows get higher, THEN you're seeing genuine consolidation rather than a continuation of the rally or early reversal.
IF volume declines steadily during the pennant formation, THEN the consolidation is healthy as participants wait for direction rather than aggressively buying or selling.
IF the breakout above the upper trendline occurs with volume expansion significantly above recent averages, THEN the continuation is confirmed by genuine buying pressure.
IF price breaks out on declining volume, TTHEN the pattern has weaker confirmation and higher risk of false breakout or limited follow-through.
IF the pennant tilts noticeably downward rather than staying horizontal, THEN you may be seeing a bearish flag instead of a bullish pennant.
IF consolidation extends beyond three to four weeks on daily charts, THEN the original momentum has likely faded and the pattern becomes less reliable.
Visual Pattern Characteristics
The consolidation phase shows specific structural features that validate the pennant formation:
-
At least two lower highs connecting to form the upper resistance trendline
-
At least two higher lows connecting to form the lower support trendline
-
The trendlines converge toward an apex, creating the pennant or small triangle shape
-
The consolidation range is notably smaller than the preceding flagpole move
-
Price should bounce between the converging lines rather than drifting lazily within them
-
The pennant typically forms in the upper portion of the overall move, not retracing deeply
Common Identification Mistakes
DO wait for the sharp flagpole to complete before even looking for a pennant—you can't identify the pattern in advance.
DO verify the consolidation has converging trendlines, not parallel lines which would make it a flag pattern.
DO confirm volume declined during consolidation and expanded on breakout before committing capital.
DON'T mark every small triangle after an up move as a bullish pennant without checking flagpole angle and strength.
DON'T ignore the time element—pennants that take months to form aren't pennants, they're regular triangles with different implications.
DON'T trade pennants that form after weak or choppy rallies where the original momentum was questionable.
DON'T confuse pennants with wedges that have two trendlines sloping the same direction rather than converging from opposite directions.
Bearish Pennant Formation


A bearish pennant forms when price drops sharply downward in a steep decline, then consolidates in a small symmetrical triangle before breaking down to continue lower. The pattern indicates the downtrend is catching its breath rather than reversing, offering traders opportunities to enter short positions or exit longs before the next leg down begins.
Like bullish pennants, bearish versions require specific structural criteria to distinguish them from random consolidation that could resolve either direction. The flagpole must show genuine selling pressure, and the consolidation must complete quickly before the downward momentum dissipates.
Requirements for Valid Bearish Pennants
The downward flagpole establishes the bearish momentum that the pattern will eventually resume:
-
The decline should be steep, ideally 45 degrees or sharper, demonstrating strong selling pressure
-
Price typically drops 15-30% or more over days to weeks depending on the timeframe
-
Volume often expands during the initial decline as sellers overwhelm buyers
-
The move frequently begins from resistance breaks, failed rallies, or other technically significant failures
-
Gradual downtrends or choppy declines don't create valid bearish pennant setups
Context and Consolidation Signals
IF the pennant forms with converging trendlines creating a symmetrical triangle, THEN you're seeing genuine pause rather than immediate continuation or reversal beginning.
IF volume declines during the pennant consolidation phase, THEN participants are waiting for direction rather than aggressively positioning.
IF the breakdown below the lower trendline occurs with volume expansion, THEN the continuation is confirmed by renewed selling pressure.
IF price breaks down on weak volume, THEN the pattern risks false breakdown or weak follow-through that reverses quickly.
IF the pennant tilts noticeably upward rather than staying horizontal, THEN you may be looking at a bullish flag attempting to reverse the downtrend.
IF consolidation extends beyond three to four weeks, THEN the original selling momentum has likely weakened and pattern reliability drops.
Distinguishing from Other Patterns
Bearish pennants can be confused with other consolidation patterns that have different implications and reliability:
-
Flags have parallel trendlines rather than converging ones—both lines angle the same direction
-
Descending triangles have flat support with descending resistance, not symmetrical convergence
-
Wedges have both trendlines sloping in the same direction rather than converging from opposite directions
-
Regular triangles form over longer periods without the sharp preceding flagpole
-
Pennants stay relatively small compared to the flagpole while triangles can be large relative to recent moves
-
The timeframe matters—pennants complete in weeks while triangles can take months
How Bearish Pennants Fail
DO verify the initial decline was sharp and powerful before trusting the consolidation as a continuation signal.
DO confirm the consolidation has symmetrical converging lines rather than other triangle configurations.
DO wait for volume expansion on the breakdown to validate the pattern before entering short positions.
DON'T trade bearish pennants that form after weak or grinding declines without genuine momentum.
DON'T ignore higher timeframe context—a bearish pennant on the daily chart means less if the weekly shows strong uptrend.
DON'T assume every small triangle in a downtrend is a bearish pennant without checking flagpole requirements.
DON'T hold through obvious support levels just because the pennant pattern suggests continuation—structure matters more than patterns.
The Psychology Behind Pennants
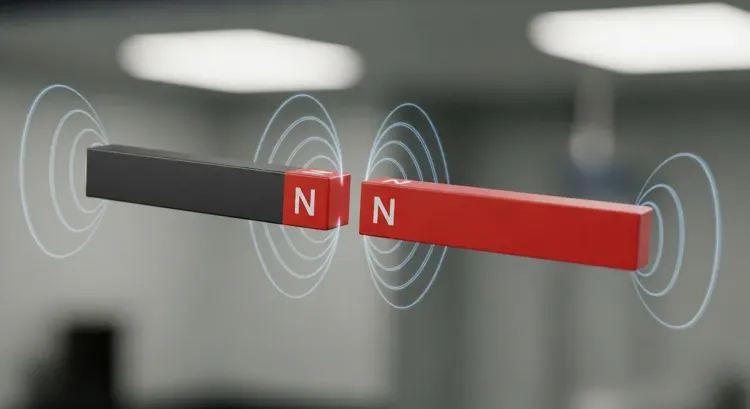
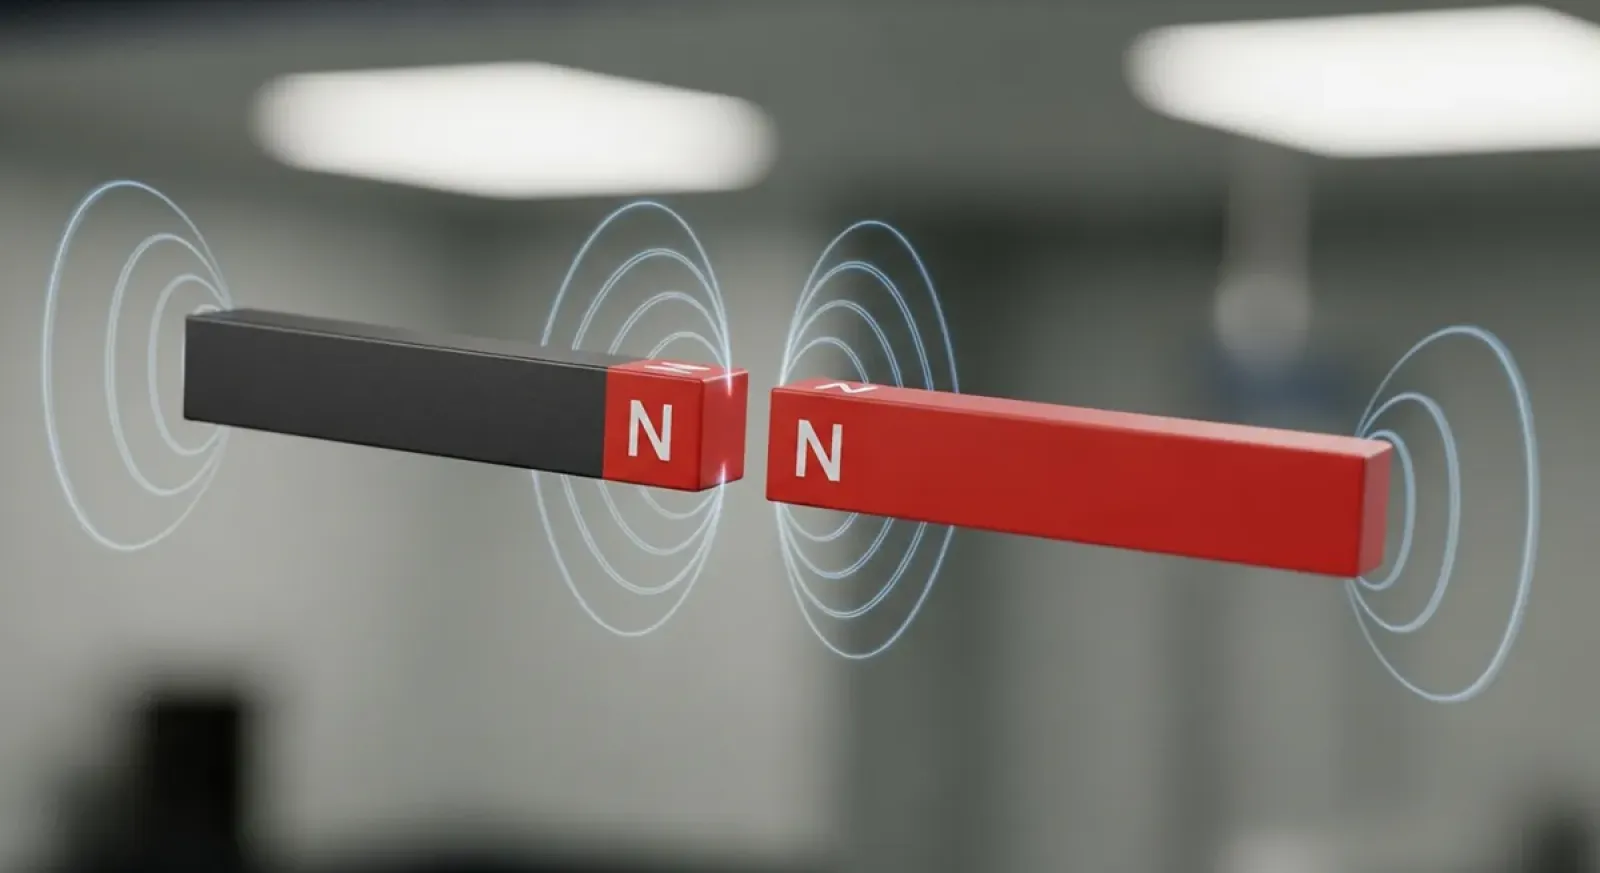
Pennants form because sharp moves create temporary equilibrium between different types of traders with opposing motivations. After a strong rally or decline, early participants want to lock in profits, new participants hesitate to chase, and counter-trend traders see an opportunity to fade the move. This creates the consolidation as these forces balance out before momentum reasserts itself:
-
Early participants take profits after capturing significant gains from the flagpole move
-
Momentum traders who missed the initial move wait for confirmation before chasing
-
Counter-trend traders attempt to pick tops or bottoms, believing the move is overextended
-
Institutional traders use the pause to accumulate or distribute additional positions
-
The consolidation represents doubt and indecision, not conviction about reversal
-
Volume declines because neither side has enough conviction to push price decisively
Market Sentiment During Consolidation
During the pennant consolidation phase, market participants experience competing emotions that create the converging price action. After a sharp rally, bulls who bought early feel validated but also anxious about giving back gains. New buyers want to participate but fear buying the top.
Bears see the pause as their chance to short what they believe is an exhausted move. This creates the back-and-forth price action within the converging trendlines as each group tests the other's conviction without either side dominating.
The pennant's symmetrical shape reflects genuine uncertainty about the next move—if bulls were clearly in control, price wouldn't consolidate. If bears were taking over, price would break down immediately rather than forming a triangle.
Think of it this way: the pennant is like a tug-of-war where both sides pull hard enough to prevent the other from winning but not hard enough to win themselves, creating temporary stalemate that holds until one side (usually the original trend) recruits enough new participants to overwhelm the opposition and break the equilibrium.
Why the Original Trend Usually Wins
The trend that created the flagpole typically resumes after the pennant because the consolidation itself doesn't invalidate the factors that caused the original move. If the rally was driven by strong fundamentals, improving sentiment, or institutional buying, those factors don't disappear just because price paused for two weeks.
Counter-trend traders entering during the pennant are betting against established momentum without new information to support reversal. Meanwhile, momentum traders are simply waiting for confirmation before adding to positions in the trend direction.
When the breakout occurs, counter-trend traders exit as their thesis fails, creating additional momentum in the original direction. The combination of new momentum traders entering, original participants adding positions, and counter-trend traders covering creates the explosive breakout that pennants are known for.
Reading the Psychological Signals
Quick Tip: Declining volume during the pennant shows genuine indecision—neither bulls nor bears have enough conviction to push aggressively, which is healthy for continuation.
Quick Tip: If volume stays elevated during consolidation, one side is still fighting hard, suggesting the pattern might resolve differently than expected or break out prematurely.
Quick Tip: The longer the pennant takes to form, the more the original momentum fades as participants lose conviction and new information enters the market.
Quick Tip: Pennants that form quickly (one to two weeks) have stronger psychology because the original move is still fresh in traders' minds and the momentum hasn't dissipated.
Quick Tip: Watch for sentiment shifts during the pennant—if news emerges that contradicts the trend direction, the pattern's reliability drops significantly as fundamentals override technical structure.
Trading Pennant Breakouts


Trading pennant breakouts requires choosing between aggressive entries on the initial break or conservative entries on retests after the breakout. Both approaches work, but they suit different risk tolerances and trading styles. The key is matching your entry method with appropriate stop placement, realistic profit targets, and position sizing that reflects the setup's probability:
-
Breakout entries capture the full move but risk false breakouts and immediate reversals
-
Retest entries offer better risk-reward but miss moves that never pull back
-
Volume confirmation on breakout significantly improves reliability regardless of entry method
-
Stop placement should account for pennant structure rather than arbitrary dollar amounts
-
Profit targets based on measured moves from the flagpole provide objective exit points
-
Position sizing should reflect pattern quality, timeframe, and confirmation strength
Entry Strategies: Timing Your Trade
Pro Tip: For breakout entries, wait for a candle to close beyond the pennant trendline with volume expansion—this filters out wicks and false breaks that immediately reverse.
Pro Tip: Retest entries involve waiting for price to break out, pull back to the broken trendline, and bounce—this confirms the level has flipped from resistance to support (or vice versa for shorts).
Pro Tip: Set alerts at the pennant trendlines rather than watching constantly—this prevents emotional decisions when price approaches breakout levels and lets you evaluate calmly when triggered.
Stop Loss Placement
Quick Tip: Place stops just inside the pennant on the opposite side from your entry—for bullish breakouts, stops go below the lower trendline; for bearish breakouts, stops go above the upper trendline.
Quick Tip: If entering on a retest, tighten stops to just beyond the retest low (for longs) or high (for shorts) since the pattern is more validated and you can use tighter risk.
Profit Targets Using Measured Moves
The measured move method provides objective profit targets based on the pattern's structure rather than wishful thinking. Measure the height of the flagpole from its start to where the pennant begins. Then project that same distance from the breakout point in the direction of the trend.
For example, if the flagpole rallied $10 from $50 to $60, and the pennant breaks out at $58, add $10 to get a target of $68. This method works because pennants typically produce continuation moves similar in magnitude to the initial flagpole.
The target isn't guaranteed—it's where statistics suggest the move will extend based on historical pattern performance. Take partial profits at the target and trail stops on the remainder if momentum continues beyond expectations.
Position Sizing for Continuation Patterns
Position sizing should reflect the pattern's quality and your confidence in the setup. High-quality pennants with perfect structure, strong volume confirmation, and favorable higher timeframe context warrant larger positions—typically your standard risk of 1-2% of account capital:
-
Perfect pennants with all confirming factors receive standard or slightly larger position sizes
-
Marginal pennants with some validation but imperfect structure get reduced size of 0.5-1%
-
Pennants on lower timeframes or without volume confirmation deserve minimal size or paper trading
-
First breakouts from fresh pennants justify more size than third or fourth attempts at breakout
-
Pennants aligned with higher timeframe trends can receive maximum position sizing
-
Never risk more than 2% on any single pennant trade regardless of conviction
Remember: Volume expansion on breakout is non-negotiable for high-probability pennant trades—breakouts on declining or average volume have significantly higher failure rates, so either skip these setups entirely or reduce position size dramatically to account for lower reliability and increased risk of false breakouts that reverse quickly.
Pennant vs. Other Continuation Patterns


Several continuation patterns look similar to pennants at first glance, creating confusion about which pattern you're actually seeing and how to trade it. The distinctions matter because each pattern has different reliability characteristics, typical duration, and breakout behavior. Understanding these differences prevents misidentification and helps you apply the right trading approach:
-
Pennants have converging symmetrical trendlines forming a small triangle
-
Flags have parallel trendlines that slope against the trend direction
-
Wedges have converging trendlines but both slope in the same direction
-
All three patterns serve as continuation signals but with different structures and timeframes
-
Misidentifying patterns leads to wrong expectations about breakout timing and targets
Pennants vs. Flags: The Key Distinctions
Flags and pennants share the same basic setup—a sharp move followed by consolidation—but the consolidation structure differs significantly:
-
Flags have parallel trendlines creating a rectangular or slightly sloped channel
-
Pennants have converging trendlines creating a symmetrical triangle
-
Flags typically tilt against the trend (downward in uptrends, upward in downtrends)
-
Pennants stay relatively horizontal regardless of trend direction
-
Flags often complete faster than pennants, sometimes in just days
-
Both patterns have similar reliability when properly identified
-
Volume characteristics are identical—declining during consolidation, expanding on breakout
Pennants vs. Wedges: Structure Comparison
IF both trendlines converge but also slope in the same direction (both up or both down), THEN you're looking at a wedge rather than a pennant.
IF the consolidation forms a symmetrical triangle with one line ascending and one descending, THEN you have a pennant pattern.
IF the wedge slopes against the trend direction (rising wedge in downtrend, falling wedge in uptrend), THEN it functions as a continuation pattern similar to pennants.
IF the wedge slopes with the trend direction, THEN it's more likely a reversal pattern rather than continuation.
IF the consolidation takes several weeks to months to form, THEN it's probably a wedge or triangle rather than a pennant which completes quickly.
IF you're uncertain whether converging lines are symmetrical or both sloping the same way, THEN zoom out and draw both trendlines carefully to see the true structure.
Choosing Pattern Interpretations
When consolidation could fit multiple pattern definitions, let the structure and context guide your interpretation. If the trendlines are clearly parallel, it's a flag regardless of how small the consolidation appears. If they converge symmetrically, it's a pennant. If they converge but both slope the same direction, it's a wedge.
Don't force patterns to fit your preferred interpretation. The market doesn't care what you call the consolidation—it will break out based on the actual forces at play. When in doubt, trade the breakout with confirmation rather than anticipating based on pattern classification.
Some consolidations genuinely fall between pattern definitions, showing characteristics of multiple patterns. In these cases, focus on the breakout direction and volume rather than getting the label perfect.
Pattern Reliability and Performance
Research on continuation pattern reliability shows pennants, flags, and wedges all perform similarly when properly identified—success rates typically range from 60-75% depending on market conditions and timeframe. The key difference isn't which pattern is "best" but rather which pattern you can identify most consistently and trade most effectively.
Pennants may have a slight edge in reliability because their symmetrical structure requires more defined consolidation, filtering out ambiguous setups. Flags form faster but can be harder to distinguish from simple pullbacks. Wedges take longer to develop, giving more time for the underlying trend to change.
The strongest setups across all three patterns share common traits: sharp preceding moves, declining volume during consolidation, expansion on breakout, and alignment with higher timeframe trends. Focus on these quality factors rather than debating which pattern type is superior.
Common Pennant Trading Mistakes


Most traders who struggle with pennant patterns can identify them correctly but make predictable execution errors that turn potentially profitable setups into losses. These mistakes stem from impatience, wishful thinking, or not fully understanding what makes pennants work. The pattern itself has solid reliability when traded properly, but common errors undermine that edge and create frustration that leads traders to abandon an otherwise useful tool.
The Most Frequent Errors
-
Trading pennants after weak moves: Marking consolidation as a pennant when the preceding move was gradual or choppy rather than sharp and impulsive
-
Entering before breakout confirmation: Buying or shorting inside the pennant hoping to catch the breakout early instead of waiting for actual break and close beyond trendlines
-
Ignoring volume requirements: Taking breakouts on declining or average volume rather than waiting for expansion that confirms genuine momentum
-
Using arbitrary profit targets: Setting targets based on round numbers or desired profit rather than measuring the flagpole and projecting that distance
-
Missing timeframe alignment: Trading 15-minute pennants without checking if daily and 4-hour charts support the same directional bias
-
Forcing pennant identification: Seeing pennants where only vague triangular consolidation exists without the required sharp preceding flagpole
-
Trading old pennants: Attempting to trade pennants that formed weeks or months ago when the original momentum has long since dissipated
-
Ignoring failed breakouts: Holding positions after price breaks out then immediately reverses back into the pennant rather than cutting losses
-
Overtightening stops: Placing stops inside the pennant to reduce risk, getting stopped out before legitimate breakouts occur
-
Trading against higher timeframes: Taking bullish pennant breakouts on 1-hour charts when the daily shows clear downtrend structure
Why These Mistakes Persist
These errors continue because they all serve the same psychological need—taking action and feeling productive rather than waiting patiently for ideal setups. Trading a weak pennant feels better than sitting on your hands. Entering before confirmation means you might catch the perfect entry. Ignoring volume lets you take trades you want regardless of validation.
The solution isn't learning more about pennants—you already understand the structure. The solution is developing discipline to skip marginal setups and wait for confirmation even when it means missing some trades that work out.
The Bottom Line: Pennant pattern failures usually result from trader error rather than pattern failure—trading without strong flagpoles, entering before confirmation, ignoring volume, using arbitrary targets, and missing timeframe context turn high-probability setups into coin flips that waste capital and time.
The Pennant Pattern: High-Probability Trading in Strong Trends


The pennant pattern works because it captures a specific moment in trend development—the brief pause after momentum creates a sharp move but before that momentum resumes. Unlike patterns that try to predict reversals or catch trend beginnings, pennants simply identify when established trends are resting before continuing. This makes them more reliable than patterns requiring you to predict what the market will do next rather than recognize what it's already doing.
Understanding pennants intellectually takes minutes. Actually profiting from them requires the discipline to wait for proper formation, strong preceding moves, volume confirmation, and favorable timeframe alignment before risking capital.
-
Pennants consist of two required parts: a sharp flagpole move and brief symmetrical triangle consolidation
-
Valid patterns complete in one to three weeks on daily charts before momentum dissipates
-
Volume should decline during consolidation and expand on breakout for highest probability
-
Measured moves from the flagpole provide objective profit targets based on pattern structure
-
Higher timeframe alignment dramatically improves reliability compared to trading against larger trends
-
The pattern works in both directions—bullish pennants in uptrends, bearish pennants in downtrends
-
Common mistakes include trading weak flagpoles, entering before confirmation, and ignoring volume
The Discipline Gap
The barrier to pennant profitability isn't pattern recognition—you can learn to spot these formations quickly with practice. The barrier is patience. Waiting for the sharp flagpole to complete before even looking for a pennant. Waiting for the consolidation to form converging trendlines. Waiting for volume to decline during consolidation. Waiting for the breakout with volume expansion.
Most traders can't tolerate that much waiting. They see a move they like and force a pennant interpretation on the consolidation that follows, regardless of whether the structure actually qualifies. They enter during consolidation hoping to catch the breakout early rather than waiting for confirmation. They ignore volume because waiting for expansion means missing some trades.
This impatience transforms a pattern with 70% reliability into one that feels like it fails constantly. The pattern hasn't changed—the execution has. Success with pennants requires accepting that most consolidations you see won't qualify as tradeable pennants, and most pennants you identify will require waiting days or weeks for proper breakout confirmation.
Pattern Reliability and Real-World Application
Pennants offer some of the best risk-reward ratios in technical analysis when traded correctly. The stop can be relatively tight just beyond the pennant structure while targets extend to the measured move distance, often producing 1:3 or better ratios. Combined with 60-70% success rates on properly identified patterns with volume confirmation, the math works strongly in your favor over time.
But that statistical edge only manifests if you actually follow the rules—strong flagpoles, symmetrical consolidation, declining volume during formation, expansion on breakout, and timeframe alignment. Skip any of these requirements and you're no longer trading high-probability pennants. You're trading consolidation triangles with unreliable outcomes.
The pennant pattern succeeds because it identifies brief pauses in genuine momentum rather than trying to predict what happens next—master the discipline to wait for proper formation with all required elements, trade only with volume confirmation on breakout, and use measured moves for targets, and you'll discover why this pattern remains one of the most reliable continuation signals in technical analysis despite being one of the simplest to understand.


