

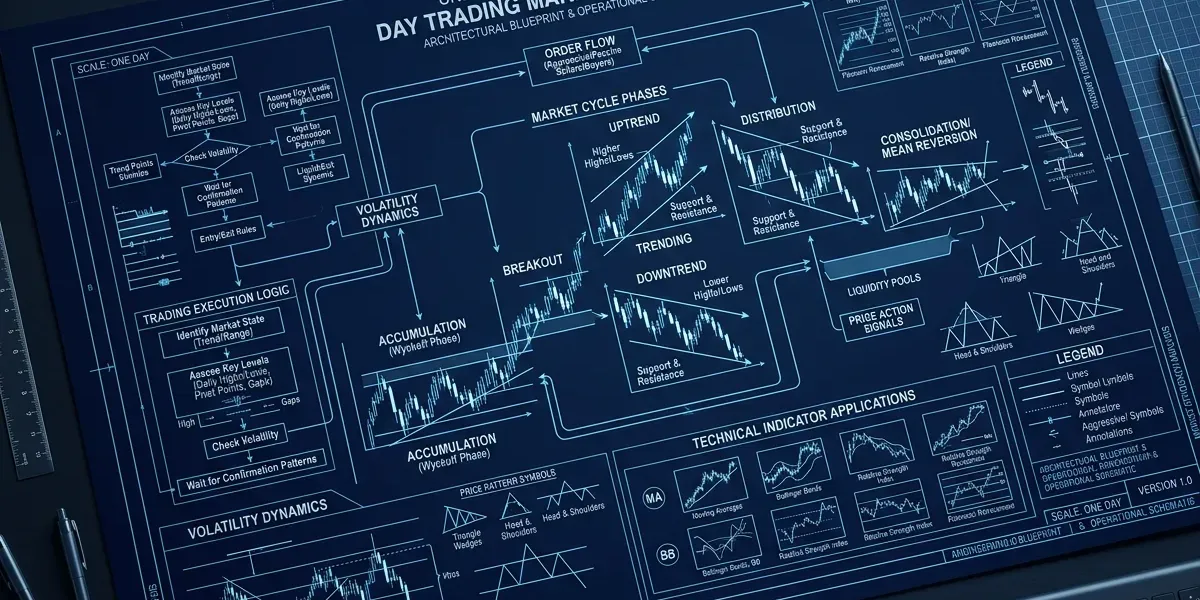

What Market Structure Really Tells You


Market structure is the underlying framework of price movement—the sequence of highs and lows that reveals whether buyers or sellers control a market and how that control evolves over time. Before you learn any pattern, indicator, or strategy, understanding market structure gives you the ability to read what price is actually doing rather than what you hope it's doing. A hammer candlestick means something entirely different depending on where it appears in the structure. A breakout has different probability depending on the structural context surrounding it. Structure is the grammar of price action, and without it, you're reading individual words without understanding the sentences they form.
Why Structure Matters More Than Patterns
Patterns get all the attention—head and shoulders, flags, triangles, wedges—but every pattern exists within a structural context that determines whether it's likely to work.
Why understanding structure creates better traders:
-
Structure tells you the dominant direction before you consider any individual setup
-
The same pattern produces different results depending on whether it aligns with or fights the prevailing structure
-
Structure reveals where buyers and sellers have previously shown their hands, creating meaningful levels
-
Understanding structure prevents fighting the trend while thinking you're trading a valid pattern
-
Structural analysis works across all timeframes, instruments, and market conditions
-
Patterns come and go in popularity, but structure remains the constant foundation of all price movement
The Foundation of Price Action
Every price action concept you'll ever learn rests on the foundation of market structure—it's not one technique among many but the lens through which all other techniques become meaningful.
Support and resistance levels derive their significance from structural swing points. Trend identification depends on reading the sequence of highs and lows that define structure. Breakout trading requires understanding when structure has genuinely changed versus when price has merely deviated temporarily. Even indicator-based trading improves dramatically when you understand the structural context in which signals appear. Market structure isn't a strategy itself—it's the context that makes strategies work or fail.
What This Article Covers
This article explains how to read market structure and apply that understanding to your trading decisions.
Topics this article will explain:
-
How to define and identify market structure through swing highs and swing lows
-
The characteristics of uptrend, downtrend, and ranging structures
-
What constitutes a valid break of structure versus temporary deviation
-
Change of character signals that anticipate structural shifts before they complete
-
How support and resistance emerge naturally from structural swing points
-
Multiple timeframe structure analysis and how higher timeframes influence lower
-
The relationship between institutional order flow and the structures it creates
-
Common mistakes traders make when analyzing market structure
The Bottom Line: Market structure is the foundation of all price action analysis, revealing through the sequence of highs and lows whether buyers or sellers control price and providing the context that determines whether any individual pattern, setup, or signal is likely to work—making structural understanding the prerequisite for reading price action like a professional.
Defining Market Structure


Market structure is simply the pattern of highs and lows that price creates over time. Strip away every indicator, every pattern name, every piece of fundamental data, and what remains is price moving up and down, creating peaks and troughs that form a readable sequence. This sequence tells you who controls the market at any given moment. When highs keep getting higher and lows keep getting higher, buyers are in control. When highs keep getting lower and lows keep getting lower, sellers are in control. When neither side can establish a clear sequence, the market is balanced and range-bound. Every trading decision you make exists within this structural context, whether you're aware of it or not.
Higher Highs and Higher Lows
An uptrend is defined by a sequence where each significant high exceeds the previous high, and each significant low holds above the previous low.
This pattern shows that buyers are willing to pay progressively higher prices (creating higher highs) and that sellers cannot push price back to previous low points (creating higher lows). The market structure remains bullish as long as this sequence continues. A pullback that holds above the prior low maintains the structure. A rally that exceeds the prior high confirms it. The uptrend doesn't require every single bar to close higher—it requires the significant swing points to maintain the higher-high, higher-low sequence. Understanding this distinction separates traders who panic during normal pullbacks from those who recognize healthy trend behavior.
Lower Highs and Lower Lows
A downtrend is defined by the opposite sequence—each significant high fails to reach the previous high, and each significant low breaks below the previous low.
This market structure shows sellers in control. Rallies fail at progressively lower levels, indicating that buyers lack the conviction or capacity to push price back to prior highs. Declines extend to new lows, showing that sellers can consistently overwhelm buying interest at each support level.
IF price makes a new swing low below the previous swing low… THEN sellers have demonstrated control by pushing price to levels buyers couldn't defend.
IF the subsequent rally fails to reach the prior swing high and creates a lower high… THEN the downtrend structure is confirmed as sellers showed up earlier and prevented recovery.
IF price then makes another new low below the most recent swing low… THEN the lower-high, lower-low sequence continues and the downtrend structure remains intact.
IF a rally exceeds the most recent lower high, breaking the sequence… THEN the structure may be shifting and the downtrend is no longer clearly intact.
IF price then makes a higher low followed by a higher high… THEN the market structure has changed from downtrend to uptrend.
IF price exceeds the lower high but then makes a new lower low… THEN the structure remains bearish despite the temporary deviation, and the downtrend continues.
The Building Blocks of Price Action


Every market structure analysis begins with identifying swing highs and swing lows—the peaks and troughs that form the skeleton of price movement. A swing high is a price peak with lower highs on both sides. A swing low is a price trough with higher lows on both sides. These points aren't arbitrary—they represent moments where one side overwhelmed the other and forced price to reverse, at least temporarily. Swing highs show where sellers stepped in with enough force to halt buying pressure. Swing lows show where buyers absorbed selling pressure and pushed price back up.
These swing points become your structural anchors. Once you can consistently identify them, you can see the sequence of highs and lows that defines trend, locate meaningful support and resistance levels, and recognize when that sequence changes. Without this foundational skill, market structure analysis becomes guesswork. With it, every chart becomes readable regardless of the underlying instrument or timeframe.
Identifying Valid Swing Points Versus Noise
Not every minor peak or trough qualifies as a significant swing point—distinguishing meaningful structural pivots from intraday noise is a core skill.
How to identify valid swing points:
-
A swing high should have at least two to three lower highs on each side, not just one bar
-
A swing low should have at least two to three higher lows on each side before qualifying as significant
-
The more bars that surround the swing point, the more significant it becomes
-
Swing points that occur on high volume carry more weight than those on low volume
-
Points where price reversed sharply and traveled significant distance are more meaningful than shallow reversals
-
Swing points visible on higher timeframes automatically qualify as significant on lower timeframes
-
Minor intraday fluctuations that reverse quickly without traveling far are noise, not structure
-
When in doubt, zoom out—if the swing point is invisible on the next higher timeframe, it may not be structurally significant
How Timeframe Affects Significance
A swing point that defines major structure on a five-minute chart might be invisible noise on a daily chart, and understanding this hierarchy prevents confusion.
Each timeframe has its own market structure created by swing points appropriate to that timeframe's scale. A swing high on a daily chart represents a level where sellers overwhelmed buyers across an entire trading day—this carries far more weight than a swing high on a five-minute chart that might represent a momentary pause lasting thirty minutes. Higher timeframe swing points take precedence because they represent larger commitment of capital and broader participant agreement about price levels. When analyzing structure, always know which timeframe's swing points you're tracking and how they relate to structure on adjacent timeframes.
Creating a Structural Map
Before taking any trade, you should be able to identify the key swing points that define current market structure across multiple timeframes.
Start by marking the most significant swing highs and swing lows on your primary trading timeframe. Connect them visually or mentally to see the sequence—is price making higher highs and higher lows, lower highs and lower lows, or chopping sideways without clear direction? Then zoom out one or two timeframes and repeat the process. The higher timeframe structure provides context for the lower timeframe moves. A pullback that looks threatening on a five-minute chart might be a normal and healthy retracement within a strong hourly uptrend.
Quick tip: Use different colors or markings for higher timeframe swing points versus lower timeframe swing points so you can instantly see which structural levels carry more weight.
Quick tip: Update your structural map at the start of each trading session and whenever price creates a new significant swing point—structure evolves and your analysis must evolve with it.
Keep In Mind: Swing highs and swing lows are the building blocks of all market structure analysis, but distinguishing significant structural pivots from minor noise requires attention to how many bars surround the swing point, the volume and velocity of the reversal, and whether the point is visible on higher timeframes—and building this skill is the foundation of reading price action professionally.
Uptrend Structure


An uptrend is defined by a specific market structure pattern: a sequence of higher highs and higher lows. Each swing high exceeds the previous swing high, demonstrating that buyers are willing to pay progressively higher prices. Each swing low holds above the previous swing low, demonstrating that sellers cannot push price back to prior levels of buyer interest. This sequence creates the stair-step pattern that characterizes healthy uptrends—price advances, pulls back to a higher low, advances again to a higher high, and repeats. Understanding this structure tells you when an uptrend is intact, when it's under threat, and when it has genuinely broken down.
What Maintains an Uptrend
The uptrend remains intact as long as the higher-high, higher-low sequence continues unbroken.
What keeps uptrend structure intact:
-
Each pullback holds above the prior swing low, creating a new higher low
-
Each rally exceeds the prior swing high, creating a new higher high
-
Pullbacks can be deep and still maintain structure if they hold above the key prior low
-
The sequence can pause without breaking—price can consolidate sideways as long as it doesn't violate the prior low
-
Momentum can slow without breaking structure—smaller higher highs still maintain the pattern
-
Even sharp drops maintain the uptrend if they hold above the structural floor created by the prior swing low
-
The trend is sustained by the cumulative evidence of buyers stepping in at higher levels repeatedly
Pullbacks Versus Structural Breaks
The difference between a healthy pullback within an uptrend and a structural break that ends the uptrend lies entirely in whether the prior swing low holds.
A pullback that retraces 50%, 61.8%, or even 78.6% of the prior move still maintains uptrend structure if it holds above the swing low that started that move. Depth alone doesn't break structure. What breaks structure is price closing below the most recent significant swing low, violating the higher-low pattern that defines the uptrend. This distinction matters enormously because it prevents you from panicking out of positions during normal retracements while alerting you when genuine structural damage occurs.
Did You Know? Many professional traders define uptrend continuation specifically as any pullback that holds above the prior swing low, regardless of depth, allowing them to stay in trends that would scare out traders focused only on percentage retracements.
Did You Know? The most common amateur mistake during uptrends is selling during healthy pullbacks that maintain structure, then watching price resume higher—understanding structure prevents this repeated error.
Trading With Uptrend Structure
When market structure confirms an uptrend, your trading should align with that structure rather than fighting it.
Trading with uptrend structure means looking for long entries at or near higher lows, expecting rallies to exceed prior highs, and treating pullbacks as opportunities rather than threats. Shorting within a confirmed uptrend means fighting the structural direction—some traders do this successfully, but they're swimming against the current and need to be right more often to compensate. The structure gives you a framework: buy the pullbacks to higher lows, trail stops below structural swing lows, and expect continuation until the structure actually breaks. This doesn't guarantee every trade works, but it aligns your positions with the dominant force rather than opposing it.
Remember: Uptrend market structure remains intact as long as price continues making higher highs and higher lows, with pullbacks of any depth maintaining the structure as long as they hold above the prior significant swing low—and trading with this structure means buying pullbacks and expecting continuation until a swing low actually breaks.
Downtrend Structure


A downtrend is defined by the opposite market structure pattern: a sequence of lower highs and lower lows. Each swing high fails to reach the previous swing high, demonstrating that buyers cannot push price back to prior levels. Each swing low breaks below the previous swing low, demonstrating that sellers can consistently overwhelm buying interest at progressively lower prices. This sequence creates a descending stair-step pattern—price declines, rallies to a lower high, declines again to a lower low, and repeats. Recognizing this structure tells you when sellers control the market, when that control is weakening, and when the downtrend has genuinely ended.
What Maintains a Downtrend
The downtrend remains intact as long as the lower-high, lower-low sequence continues unbroken.
What keeps downtrend structure intact:
-
Each rally fails below the prior swing high, creating a new lower high
-
Each decline breaks below the prior swing low, creating a new lower low
-
Rallies can be sharp and still maintain structure if they fail below the key prior high
-
The sequence can pause without breaking—price can consolidate sideways as long as it doesn't exceed the prior high
-
Selling pressure can slow without breaking structure—shallower lower lows still maintain the pattern
-
Even strong bounces maintain the downtrend if they reverse below the structural ceiling created by the prior swing high
-
The trend is sustained by the cumulative evidence of sellers stepping in at lower levels repeatedly
Rallies Versus Structural Breaks
The difference between a normal rally within a downtrend and a structural break that ends the downtrend lies entirely in whether the prior swing high holds as resistance.
A rally that retraces 50%, 61.8%, or even 78.6% of the prior decline still maintains downtrend structure if it fails below the swing high that started that decline. The size of the bounce doesn't break structure. What breaks structure is price closing above the most recent significant swing high, violating the lower-high pattern that defines the downtrend. This distinction prevents you from covering shorts prematurely during normal retracements while alerting you when genuine structural change occurs.
Did You Know? Bear market rallies are notorious for retracing large percentages of prior declines while still maintaining downtrend structure, trapping buyers who mistake depth of rally for structural change.
Did You Know? The most common amateur mistake during downtrends is buying every bounce thinking the bottom is in, only to watch price resume lower—understanding that structure requires a higher high, not just a bounce, prevents this repeated error.
Trading With Downtrend Structure
When market structure confirms a downtrend, your trading should align with that structure rather than fighting it.
Trading with downtrend structure means looking for short entries at or near lower highs, expecting declines to break prior lows, and treating rallies as opportunities to enter short rather than signals that the trend has reversed. Buying within a confirmed downtrend means fighting the structural direction—you need the structure to actually break before long positions make sense. The structure gives you a framework: short the rallies to lower highs, trail stops above structural swing highs, and expect continuation until the structure actually breaks. This doesn't guarantee every short works, but it aligns your positions with the dominant force controlling price.
Remember: Downtrend market structure remains intact as long as price continues making lower highs and lower lows, with rallies of any size maintaining the structure as long as they fail below the prior significant swing high—and trading with this structure means shorting rallies and expecting continuation until a swing high actually breaks.
Ranging Structure


Not all market structure trends directionally—sometimes price moves sideways, creating a range where neither buyers nor sellers can establish dominance. Ranging structure is characterized by swing highs that occur at roughly similar levels and swing lows that occur at roughly similar levels, without the progressive advancement or decline that defines trending structure. Price bounces between a ceiling and a floor, with each side showing enough strength to halt the other but not enough to establish directional control. Recognizing ranging structure prevents you from applying trending strategies to sideways markets and helps you identify when genuine breakouts occur versus when price is simply testing boundaries.
Identifying Range Boundaries
The boundaries of a range emerge naturally from the swing points that price respects repeatedly.
How to identify range boundaries through structure:
-
Look for two or more swing highs at approximately the same level to define resistance
-
Look for two or more swing lows at approximately the same level to define support
-
The more times price respects these levels, the more significant the range becomes
-
Range boundaries don't need to be exact—zones of support and resistance work better than precise lines
-
Volume often decreases during range development as participation wanes during directionless movement
-
The swing highs and lows within the range should show no clear directional sequence
-
A range is confirmed when price has tested both boundaries at least twice and reversed each time
-
Width of the range determines whether it's tradeable or too tight for meaningful opportunities
False Breakouts Within Ranges
Ranges are notorious for false breakouts—price briefly exceeds a boundary only to reverse back inside, trapping traders who entered expecting continuation.
False breakouts occur because ranges represent equilibrium between buyers and sellers. When price approaches a boundary, one side attempts to take control, but the other side is still present and capable of defending. Price may pierce the boundary, triggering breakout entries and stops, only to find that the opposing side absorbs the move and pushes price back into the range. This creates a cycle where false breakouts become fuel for moves in the opposite direction as trapped traders exit.
Did You Know? Studies suggest that initial breakouts from established ranges fail more often than they succeed, which is why many professional traders wait for a retest of the broken level before entering, or trade the fade back into the range rather than the breakout itself.
Did You Know? False breakouts often mark the extreme of the range before price travels to the opposite boundary, making them useful signals for range traders who recognize the pattern rather than falling victim to it.
When Ranges Resolve Into Trends
Every range eventually ends when one side finally overwhelms the other and establishes the market structure sequence that defines trend.
The shift from range to trend occurs when price breaks a boundary and then establishes the directional sequence—a higher high following an upside breakout confirms the range has ended and an uptrend has begun, while a lower low following a downside break confirms a new downtrend. The breakout alone isn't enough because false breakouts occur so frequently. What confirms the end of the range is the subsequent price action that establishes trending structure. A genuine upside resolution shows price breaking above range resistance, pulling back to form a higher low above former resistance, and then making another higher high. Until that sequence appears, the range may still be intact despite the apparent breakout.
Remember: Ranging market structure is defined by swing highs and lows at similar levels rather than a directional sequence, with boundaries identified through repeated swing point clusters—and because false breakouts occur frequently within ranges, the resolution into a new trend requires confirmation through the establishment of a higher-high, higher-low or lower-high, lower-low sequence after the boundary breaks.
Breaks of Structure


A break of structure occurs when price violates the sequence of highs and lows that defined the prevailing trend. In an uptrend, this means price closing below the most recent significant swing low, breaking the higher-low pattern. In a downtrend, this means price closing above the most recent significant swing high, breaking the lower-high pattern. These moments matter because they signal potential shifts in control between buyers and sellers. However, not every violation of a swing point constitutes a valid structural break—distinguishing genuine breaks from temporary deviations is one of the most important skills in market structure analysis.
What constitutes a valid break of structure:
-
Price must close beyond the swing point, not just wick through it
-
The violation should occur on meaningful volume, not during low-liquidity periods
-
The swing point being broken should be structurally significant, not minor noise
-
The break should be clear and decisive, not ambiguous or marginal
-
Multiple candles closing beyond the level strengthens the validity of the break
-
The context matters—a break at trend exhaustion carries more weight than a break during strong momentum
-
Higher timeframe swing points require more convincing breaks than lower timeframe points
The Difference Between a Break and a Deviation
Price can temporarily exceed a structural swing point without genuinely breaking the market structure—these deviations trap traders who act too quickly.
IF price wicks below a swing low but closes back above it… THEN this is likely a deviation or stop hunt rather than a valid structural break.
IF price closes below a swing low but immediately reverses and closes back above it the next bar… THEN the break may be a false break, and waiting for confirmation before acting is wise.
IF price closes below a swing low and the subsequent candle also closes below it… THEN the break has more validity and is less likely to be a deviation.
IF price breaks a swing low but volume is significantly below average… THEN the break lacks conviction and may fail to follow through.
IF price breaks a swing low during regular trading hours with expanding volume and continues lower… THEN this is likely a valid structural break signaling potential trend change.
IF price breaks a swing low in pre-market or after-hours with minimal volume… THEN treat this as suspect until regular session confirms or rejects the break.
Confirmation Requirements
Different traders require different levels of confirmation before acting on structural breaks, and your approach should match your risk tolerance and trading style.
Levels of structural break confirmation:
-
Aggressive: Enter immediately on the candle that closes beyond the swing point
-
Moderate: Wait for a second candle to close beyond the level, confirming the break isn't immediately rejected
-
Conservative: Wait for price to break the level, pull back to test it from the other side, and then continue in the break direction
-
Very conservative: Wait for a full new swing point to form beyond the break, establishing the new directional sequence
-
Volume confirmation: Require above-average volume on the break regardless of which timing approach you use
-
Timeframe confirmation: Require the break to be visible and confirmed on a higher timeframe before acting on lower timeframe signals
Trading Breaks Versus Fading Them
Whether you trade structural breaks as continuation signals or fade them as false breakout opportunities depends on context, confirmation, and your overall trading approach.
Trading breaks means entering in the direction of the break, expecting the new structural direction to continue. This approach works best when breaks occur with strong volume, at the end of extended trends showing exhaustion, or when confirmed by multiple timeframes. Fading breaks means betting that the break will fail and price will reverse back into the prior structure. This approach works best when breaks occur on weak volume, during strong established trends that show no signs of exhaustion, or when the break contradicts higher timeframe structure. Neither approach is universally correct—context determines which makes sense for any specific situation.
Think of it this way: A break of market structure is like a vote that challenges the current regime—some votes lead to genuine change while others get rejected and the status quo continues, and your job is to evaluate whether this particular challenge has enough support to succeed or whether the existing structure will reassert itself.
Change of Character


Before market structure officially breaks, the character of price action often shifts in ways that signal the change is coming. Change of character refers to subtle alterations in how price behaves—momentum slowing, swing points becoming weaker, or previously reliable patterns failing—that suggest the current trend is losing steam before the structural break confirms it. Recognizing these early warning signs allows you to anticipate structural shifts rather than simply reacting after the break has already occurred, giving you better positioning and earlier entries.
Early warning signs that structure may shift:
-
Momentum decreasing with each successive swing in the trend direction
-
Swing points becoming smaller—higher highs that barely exceed prior highs in an uptrend
-
Time between swing points extending as the trend struggles to make progress
-
Volume declining on moves in the trend direction while increasing on counter-trend moves
-
Failed attempts to continue the trend sequence that don't quite reach new highs or lows
-
Increased volatility and two-way price action replacing the smooth trending behavior
-
Lower timeframe structure breaking while higher timeframe structure remains intact
-
Support or resistance levels that previously held cleanly now showing messy, contested price action
How Momentum Changes Before Structure Breaks
The speed and conviction of price movement often deteriorates before the structural break confirms the trend change.
In a healthy uptrend, each rally leg shows strong momentum, covers significant distance, and achieves new highs decisively. As the trend ages, you'll often notice the rallies becoming weaker—they cover less ground, take more time, show more hesitation, and barely exceed prior highs rather than blowing through them. The pullbacks may start holding higher, which looks bullish, but if the rallies can't capitalize on those higher lows with meaningful higher highs, momentum is telling you something. This divergence between the structural pattern (still making higher highs) and the momentum behind those swing points (weakening) is a classic change of character signal that often precedes the eventual structural break.
Failed Swing Points as Signals
When swing points fail to complete the expected sequence, the character of the market has changed even if structure hasn't officially broken.
A failed swing high in an uptrend occurs when price rallies toward the prior high, fails to exceed it, and reverses. This isn't a structural break—the higher-low, higher-high sequence only breaks when a swing low is violated—but it's a character change showing that buyers couldn't continue the pattern. Similarly, a failed swing low in a downtrend shows sellers couldn't push to new lows, signaling weakening bearish momentum before any structural break confirms. These failures often occur at the third or fourth attempt in a sequence, suggesting exhaustion.
Pro tip: Track whether each new swing point shows stronger or weaker momentum than the previous one—weakening momentum across multiple swing points is a character change that often precedes structural breaks by several bars or even sessions.
Pro tip: Pay special attention when price makes a marginal new high or low that quickly reverses—these "barely there" swing points that don't hold suggest exhaustion and often mark the final swing before structure changes.
Using Change of Character to Anticipate
Recognizing change of character allows you to position ahead of structural breaks rather than chasing confirmation after everyone else sees it.
If you notice weakening momentum, failed swing attempts, and deteriorating price behavior in an uptrend, you can begin tightening stops, reducing position size, or preparing short positions before the market structure officially breaks. This doesn't mean acting before confirmation—it means preparing so that when confirmation arrives, you're ready to act immediately rather than scrambling to analyze. Some traders use change of character signals to take partial profits on existing positions while leaving runners with wider stops. Others use these signals to identify potential entries in the new direction once minor structural breaks occur on lower timeframes. The key is using the early warning to improve your positioning rather than waiting for the obvious break that everyone sees simultaneously.
The Bottom Line: Change of character signals—including weakening momentum, failed swing points, and deteriorating price behavior—often precede official market structure breaks by multiple bars or sessions, and recognizing these shifts allows you to anticipate structural changes and position accordingly rather than reacting after the break is obvious to everyone.
Support and Resistance Through a Structural Lens


Support and resistance levels are everywhere on a chart, but not all levels carry equal weight. Through a market structure lens, the levels that matter most are those created by significant swing points—the highs and lows that define the structural sequence. These levels matter because they represent prices where buyers or sellers previously demonstrated enough force to reverse direction. A swing low in an uptrend shows where buyers stepped in and overwhelmed sellers. A swing high in a downtrend shows where sellers stepped in and overwhelmed buyers. When price returns to these levels, the question becomes whether the same participants will defend again.
Why structural levels matter more than arbitrary lines:
-
Swing points represent actual moments where control shifted between buyers and sellers
-
These levels attracted enough participation to reverse price direction, not just pause it
-
Other traders watching the same structure see the same levels, creating convergent expectations
-
Structural swing points are objective—they exist on the chart regardless of who draws them
-
Arbitrary support and resistance lines depend on interpretation, but swing points are definitive
-
The sequence of swing points tells you which levels remain relevant and which have been invalidated
-
Higher timeframe swing points carry more weight because they represent larger-scale reversals
Swing Points as Natural Support and Resistance
Every significant swing high becomes potential resistance on future rallies, and every significant swing low becomes potential support on future pullbacks.
This relationship is straightforward: if sellers showed up at $50 with enough force to create a swing high, they may show up again when price returns to $50. If buyers defended $45 strongly enough to create a swing low, they may defend again when price pulls back to $45. The market structure itself generates the most meaningful support and resistance levels. You don't need to hunt for levels or draw speculative lines—the swing points that define the trend also define where battles were fought and where future battles are likely to occur. The more significant the swing point (visible on higher timeframes, created on high volume, produced a large reversal), the more significant the support or resistance it creates.
How Broken Structure Becomes New Support or Resistance
When a structural level breaks, it often flips roles—former support becomes resistance, and former resistance becomes support.
This polarity flip occurs because of the participants trapped on the wrong side. When a swing low breaks, all the buyers who bought at that support level are now underwater. If price rallies back to that level, many of those trapped buyers will sell to exit at breakeven, creating selling pressure that turns former support into resistance. The same logic works in reverse—when resistance breaks, sellers who shorted there are trapped, and their covering creates buying pressure that turns former resistance into support.
DO expect broken swing lows to act as resistance on retests after structural breaks to the downside.
DO expect broken swing highs to act as support on retests after structural breaks to the upside.
DON'T assume every broken level will be tested—some breaks continue immediately without looking back.
DON'T treat all broken levels equally—higher timeframe structural breaks create more significant polarity flips than lower timeframe breaks.
The Hierarchy of Structural Levels
Not all structural support and resistance carries equal weight—a hierarchy exists based on timeframe, significance, and recency.
The most powerful levels are higher timeframe swing points that defined major market structure shifts—these represent massive battles between buyers and sellers and often hold across multiple tests. Below these sit regular swing points visible on your primary trading timeframe. Below those are minor swing points that are significant only on lower timeframes. When price approaches a zone with multiple overlapping structural levels from different timeframes, that confluence creates particularly significant support or resistance. Recent swing points generally carry more weight than older ones because the participants who created them are more likely to still be in the market. Understanding this hierarchy prevents you from treating all lines on a chart as equally important and focuses your attention on the structural levels that actually matter for your timeframe.
Multiple Timeframe Structure Analysis


Every chart exists within a larger context. The five-minute chart you're watching exists within the structure of the hourly chart, which exists within the structure of the daily chart, which exists within the structure of the weekly chart. Each timeframe has its own market structure defined by its own swing points, and these structures can align or conflict. Understanding how timeframes relate to each other prevents the common mistake of fighting a larger trend while thinking you're trading a valid setup. A perfect bearish structure on the fifteen-minute chart means very little if it's just a pullback within a powerful daily uptrend.
How Higher Timeframe Structure Trumps Lower
Higher timeframe structure carries more weight because it represents larger commitments of capital from more participants over longer periods.
Why higher timeframes dominate:
-
Higher timeframe swing points are created by more trading activity and more participant agreement
-
Institutional traders and larger accounts operate primarily on higher timeframes
-
Lower timeframe moves often reverse at higher timeframe structural levels
-
A trend on the daily chart can absorb many lower timeframe structural breaks without being affected
-
Higher timeframe support and resistance levels hold more reliably than lower timeframe levels
-
The dominant direction on the higher timeframe pulls price in that direction over time despite lower timeframe noise
-
Lower timeframe structure breaks that conflict with higher timeframe direction fail more often
-
When structures align across timeframes, moves tend to be cleaner and more reliable
When Timeframes Conflict
Some of the most important analytical moments occur when lower timeframe structure conflicts with higher timeframe structure—understanding what these conflicts mean improves your decision-making.
IF daily structure is in a clear uptrend but the hourly shows a break of structure to the downside… THEN the hourly break is likely a pullback within the daily uptrend rather than a trend reversal.
IF daily structure is ranging but the fifteen-minute shows a strong trending structure… THEN the fifteen-minute trend will likely reverse when price reaches the daily range boundary.
IF weekly structure shows a fresh break of structure to the upside and daily is pulling back… THEN the daily pullback is an opportunity to align with the weekly breakout rather than a signal to short.
IF lower timeframe structure breaks in the direction of higher timeframe structure… THEN this alignment increases the probability that the move will continue.
IF lower timeframe structure breaks against higher timeframe structure… THEN expect the move to fail or reverse when it encounters higher timeframe structural levels.
IF all timeframes from weekly down to hourly show the same structural direction… THEN conditions favor strong continuation moves with higher probability setups.
Building a Multi-Timeframe Picture
Before taking any trade, you should be able to articulate the market structure on at least two or three timeframes and how they relate to each other.
Start with a higher timeframe—weekly or daily depending on your trading style—and identify the dominant structural direction. Note the key swing points that define that structure and where price currently sits relative to them. Then move to your trading timeframe—hourly, fifteen-minute, or whatever you primarily use—and map its structure. Ask how the lower timeframe structure relates to the higher. Is your trading timeframe trending with the higher timeframe, pulling back within it, or conflicting with it? Finally, you might drop to an even lower timeframe for entry precision, looking for structural breaks or confirmations that align with your higher timeframe thesis. This layered approach means you always know the dominant direction, where you are within that direction, and what needs to happen for your trade thesis to be invalidated.
Remember: Higher timeframe market structure trumps lower timeframe structure because it represents larger participant commitment, and building a multi-timeframe picture before every trade—understanding the dominant direction, current position within that structure, and how timeframes align or conflict—dramatically improves your ability to identify high-probability setups and avoid fighting the prevailing trend.
Order Flow and Market Structure


Market structure doesn't appear randomly—it's created by the aggregate buying and selling decisions of all participants, with institutional activity leaving the most visible footprints. Large players can't enter or exit positions instantly without moving price against themselves, so they accumulate and distribute over time, creating the swing points and structural patterns you observe on charts. Understanding this connection between order flow and structure transforms your reading of price action from pattern recognition into understanding of what's actually happening beneath the surface.
How institutional activity creates structure:
-
Large buyers accumulating positions create demand zones that become swing lows as their buying absorbs selling pressure
-
Large sellers distributing positions create supply zones that become swing highs as their selling absorbs buying pressure
-
Institutions can't buy or sell their full size at once, so they work orders over time, creating ranges and consolidation patterns
-
The swing points that define market structure often mark prices where institutional orders were filled
-
Breakouts occur when institutional accumulation or distribution completes and the holding pattern ends
-
Failed breakouts often indicate institutional orders on the opposite side that absorbed the breakout attempt
-
Higher timeframe structure reflects larger institutional activity than lower timeframe structure
-
The most significant structural levels coincide with zones of heavy institutional participation
Recognizing Accumulation and Distribution
Accumulation occurs when large players quietly build long positions without driving price up prematurely, while distribution occurs when they quietly sell positions without driving price down prematurely.
During accumulation, you'll often see ranging structure with swing lows that hold firmly while upside tests fail to follow through—institutions are buying the dips but not chasing price higher. The range persists until accumulation completes, then price breaks out to the upside as buying pressure no longer needs to be restrained. During distribution, you'll see ranging structure with swing highs that hold firmly while downside tests fail to follow through—institutions are selling the rips but price keeps bouncing. The range persists until distribution completes, then price breaks down.
Quick tip: Volume patterns during ranges can reveal accumulation versus distribution—higher volume on tests of support suggests accumulation, while higher volume on tests of resistance suggests distribution.
Quick tip: The duration of a range often correlates with the size of the subsequent move, as longer accumulation or distribution periods indicate larger institutional positioning that will drive bigger breakouts.
Warning: Not every range represents institutional accumulation or distribution—some ranges are simply periods of genuine equilibrium with no large player agenda.
Warning: Attempting to identify accumulation or distribution in real-time is difficult and often amounts to guessing—confirmation comes from the breakout direction, not from predicting it before it happens.
Why Price Returns to Structural Levels
Price often revisits significant swing points because institutional orders frequently remain unfilled at these levels, creating magnetic zones that attract future price action.
When institutions place large orders, they rarely get completely filled at their desired price. Some portion of the order remains, waiting at that level. Additionally, institutions often scale into positions at specific prices and want to add more at those same levels if price returns. This creates zones where demand or supply exists even when price has moved away. The market structure swing points you identify often coincide with these institutional order zones. When price returns to a prior swing low, the remaining buy orders may activate, creating support. When price returns to a prior swing high, remaining sell orders may activate, creating resistance. This is why structural levels matter—they mark not just where reversals happened historically, but where orders may still exist waiting to be filled.
Common Market Structure Mistakes


Market structure analysis is fundamentally simple—identify swing highs and lows, observe the sequence, recognize when that sequence changes. Yet traders consistently complicate it, misapply it, or ignore it in ways that damage their results. Most of these mistakes stem from impatience, overconfidence, or trying to extract more precision from structural analysis than it can provide. Recognizing these common errors before you make them saves both capital and frustration.
Common mistakes when analyzing market structure:
-
Overcomplicating structural analysis by marking every minor swing point rather than focusing on significant structural pivots
-
Cluttering charts with so many levels that the actual structure becomes invisible beneath the noise
-
Treating market structure as a mechanical system with precise rules rather than a framework for understanding price behavior
-
Ignoring timeframe context by analyzing structure on one timeframe without considering how it fits within higher timeframe structure
-
Taking trades against daily structure because the fifteen-minute chart looks good, then wondering why they fail at higher timeframe levels
-
Trading against dominant structure because a setup appears valid in isolation without recognizing it fights the prevailing trend
-
Shorting during uptrends because a bearish pattern formed, ignoring that bearish patterns in uptrends fail more often
-
Calling breaks of structure too early based on wicks through swing points rather than closes beyond them
-
Declaring trend changes on marginal violations that immediately reverse rather than waiting for decisive breaks
-
Failing to wait for confirmation by entering immediately on structural breaks without evidence the break will hold
-
Chasing every break of structure without requiring a retest, second candle confirmation, or higher timeframe alignment
-
Treating all swing points as equally significant rather than recognizing the hierarchy based on timeframe and volume
-
Obsessing over exact prices rather than treating structural levels as zones where reactions become likely
-
Abandoning structural analysis after a few failures rather than recognizing that structure provides probability, not certainty
-
Mixing timeframes inconsistently—identifying structure on the daily but then trading signals on the five-minute that contradict it
-
Looking for structure that confirms your existing bias rather than objectively reading what the chart shows
-
Forcing structural reads on charts that lack clear structure, seeing higher highs and higher lows where choppy mess exists
-
Failing to update structural analysis as new swing points form, trading based on outdated structural maps
-
Using structure to predict rather than to describe—structure tells you the current state, not what must happen next
Building Fluency in Market Structure


Market structure is the language that price speaks. Every candlestick, every swing point, every trend and range tells a story written in this language. When you first learn to read structure, the process feels mechanical—identify the swing high, identify the swing low, determine the sequence, check the higher timeframe. But with practice, structural reading becomes automatic, like reading words rather than sounding out individual letters. You'll glance at a chart and immediately see the uptrend, the pullback holding higher lows, the resistance created by prior swing highs. This fluency doesn't come from memorizing rules. It comes from looking at thousands of charts and asking the same questions until the answers appear without conscious effort.
From Reading Structure to Trading Structure
Understanding market structure intellectually differs from integrating it into your trading decisions, and the gap closes only through deliberate practice over time.
Start by adding structural analysis to your daily routine before the market opens. Mark the significant swing points on your primary charts. Note the structural direction on multiple timeframes. Identify where price currently sits within the structure—early in a trend, late in a trend, pulling back, breaking down. Do this consistently even on days you don't plan to trade. Over time, you'll start seeing structure without consciously marking it. Then begin filtering your trade ideas through structural context. Before any entry, ask whether the trade aligns with dominant structure or fights it. Ask whether structural levels above and below support your thesis or threaten it. Reject trades that conflict with higher timeframe structure no matter how appealing they look in isolation. This integration happens gradually. You won't transform your trading overnight. But each day of deliberate structural analysis builds the pattern recognition that eventually makes reading market structure as natural as reading text—and that fluency becomes the foundation for every trading decision you make.
