


What the Cup and Handle Pattern Tells Traders


The cup and handle pattern is one of the most recognizable and reliable bullish continuation patterns in technical analysis. Shaped like a teacup when viewed on a price chart, the pattern forms when a stock pulls back, rounds out a bottom over weeks or months, recovers to its prior high, and then consolidates briefly before breaking out to new highs. First popularized by William O'Neil in his book "How to Make Money in Stocks," the cup and handle has become a staple of growth stock investing and momentum trading. The pattern represents a specific sequence of accumulation, consolidation, and breakout that has produced some of the most powerful moves in market history.
Why This Pattern Endures
Decades after O'Neil introduced it to mainstream traders, the cup and handle pattern remains a go-to setup for breakout traders and investors seeking stocks poised for significant advances.
Why the cup and handle has stood the test of time:
-
The pattern reflects genuine market psychology—accumulation during the cup, final shakeout during the handle, and commitment on the breakout
-
The visual shape is distinctive and relatively easy to identify compared to more subjective patterns
-
Clear entry points, stop levels, and price targets make trade planning straightforward
-
Historical backtesting and real-world results have validated the pattern across different markets and eras
-
The pattern works across multiple timeframes, from daily charts to weekly and even intraday applications
-
Growth stock investors like O'Neil built verifiable track records using cup and handle setups as a core strategy
-
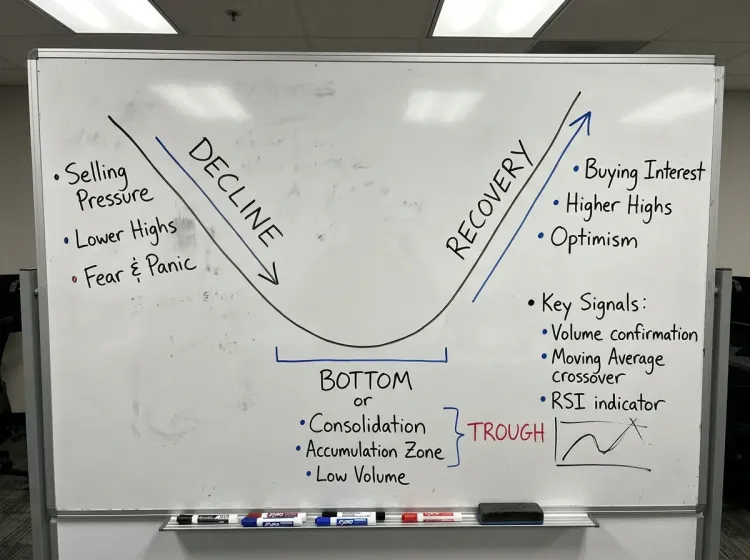
The rounding bottom formation suggests genuine accumulation rather than sharp V-shaped recoveries driven by short covering
The Bullish Continuation Thesis
The cup and handle pattern is classified as a bullish continuation pattern, meaning it typically appears during uptrends and signals that the uptrend will continue after a period of consolidation.
The logic is straightforward: a stock in an uptrend pulls back and builds a base (the cup), attempts to resume the uptrend but pauses briefly (the handle), and then breaks out above resistance to continue the prior trend. The pattern represents a pause that refreshes rather than a reversal. The pullback shakes out weak holders, allows moving averages to catch up with price, and creates a new launching pad for the next leg higher. Importantly, the cup and handle requires a prior uptrend to qualify as a continuation pattern—without that context, you're looking at something else entirely.
What This Article Covers
This article explains how to identify, validate, and trade cup and handle patterns across different market conditions and timeframes.
Topics this article will cover:
-
The visual characteristics and structure of both the cup and the handle components
-
Detailed anatomy of proper cup formation including depth, duration, and shape requirements
-
Handle characteristics that distinguish high-probability setups from weak formations
-
How to identify valid cup and handle patterns and filter out imposters
-
Entry strategies, stop loss placement, and position sizing for cup and handle breakouts
-
Measuring price targets using the pattern's structure
-
Variations including cups without handles, multi-year formations, and the bearish inverted version
-
Common mistakes that cause traders to misidentify or poorly execute cup and handle trades
The Bottom Line: The cup and handle pattern represents one of technical analysis's most enduring bullish setups, combining clear visual structure with sound market psychology to identify stocks poised for continuation of their uptrends—and understanding how to properly identify and trade this pattern gives you a reliable tool for capturing breakout moves.
Understanding the Cup and Handle Pattern


The cup and handle pattern gets its name from its visual resemblance to a tea cup viewed from the side. The "cup" portion forms as price declines from a high, rounds out a bottom over time, and recovers back toward the original high, creating a U-shaped or bowl-shaped formation. The "handle" forms when price consolidates just below the prior high, typically drifting slightly downward or sideways before breaking out. Together, these components create a pattern that signals accumulation is complete and a new upward leg is ready to begin.
Visual characteristics of the cup and handle:
-
The cup forms a rounded U-shape rather than a sharp V-shape bottom
-
The left side of the cup shows the initial decline from a prior high
-
The bottom of the cup shows price stabilizing and beginning to round upward
-
The right side of the cup shows price recovering toward the prior high
-
The cup's high points on both sides should be roughly equal, forming a horizontal resistance level
-
The handle forms in the upper portion of the pattern, typically in the upper third of the cup's range
-
The handle drifts downward or sideways, usually retracing no more than one-third to one-half of the cup's depth
-
The breakout occurs when price moves above the resistance level formed by the cup's highs and the handle's ceiling
The Pattern's Origin and William O'Neil
William O'Neil, founder of Investor's Business Daily, popularized the cup and handle pattern in his 1988 book "How to Make Money in Stocks," though traders had observed similar formations before he codified them.
O'Neil studied the characteristics of the best-performing stocks over decades and found that many of them formed cup and handle patterns before making their biggest advances. He integrated the pattern into his CAN SLIM investment methodology, which combines technical pattern recognition with fundamental analysis of earnings growth, institutional sponsorship, and market direction. O'Neil's research suggested that stocks forming proper cup and handle patterns with strong fundamental characteristics significantly outperformed the broader market. His work transformed a visual observation into a systematic approach with specific criteria for cup depth, handle formation, volume behavior, and breakout confirmation. While O'Neil focused primarily on growth stocks and daily or weekly charts, subsequent traders have applied the cup and handle pattern across asset classes and timeframes.
Why the Shape Matters
The rounded U-shape of the cup matters because it represents gradual accumulation and genuine base-building rather than a panic-driven decline and sharp recovery.
IF the cup forms a sharp V-bottom with a rapid decline and equally rapid recovery... THEN the pattern is less reliable because sellers haven't been fully absorbed and the base lacks the time needed for proper accumulation.
IF the cup forms a rounded bottom with a gradual decline, extended basing period, and measured recovery... THEN the pattern reflects genuine accumulation where strong hands have replaced weak holders over time.
IF the handle drifts lower with declining volume and holds in the upper portion of the cup... THEN this suggests healthy consolidation and final shakeout of remaining weak holders before breakout.
IF the handle drops deeply into the cup, retracing more than half the cup's depth... THEN the pattern is weakened because too much technical damage has occurred during the consolidation.
IF the handle forms with tight, controlled price action over one to several weeks... THEN buyers are absorbing supply and preparing for the breakout attempt.
IF the handle forms with wild, volatile swings over an extended period... THEN the stock may lack the institutional support needed for a successful breakout.
Timeframes Where the Pattern Appears
The cup and handle pattern appears across multiple timeframes, though the pattern's reliability and typical price target vary depending on the chart period you're analyzing.
Timeframe considerations for cup and handle patterns:
-
Weekly charts produce the most reliable cup and handle patterns with the largest potential price targets, often taking six months to two years to complete
-
Daily charts offer more frequent opportunities with patterns completing in seven to sixty-five weeks, though moves tend to be smaller than weekly patterns
-
O'Neil's original research focused on daily and weekly timeframes for growth stock investing
-
Intraday cup and handle patterns form on hourly, fifteen-minute, or even five-minute charts for day traders
-
Shorter timeframe patterns require quicker execution and tighter risk management due to increased noise
-
Multi-year cup and handle patterns on monthly charts can precede major secular moves but require exceptional patience
-
The depth and duration of the cup should be proportional to the timeframe—a cup on a weekly chart should take longer to form than one on a daily chart
-
Volume analysis becomes more reliable on longer timeframes where daily fluctuations average out
-
Traders often confirm shorter timeframe patterns by checking for alignment with longer timeframe trends
Remember: The cup and handle pattern represents a specific structure—a rounded cup followed by a smaller handle consolidation—that works across multiple timeframes, with the shape mattering because rounded formations indicate genuine accumulation while V-shaped recoveries and deep handles suggest incomplete basing or excessive technical damage.
Anatomy of the Cup

The cup portion of the cup and handle pattern represents the foundational base-building phase where a stock corrects from a prior high, finds support, and gradually recovers. This U-shaped formation isn't random—each phase of the cup serves a purpose in the overall pattern structure. The left side shakes out early buyers and creates supply. The bottom absorbs that supply through patient accumulation. The right side confirms that demand has overcome supply as price recovers toward the prior high. Understanding each phase helps you evaluate whether a forming cup has the characteristics of a high-probability setup.
Characteristics of a well-formed cup:
-
The left side decline typically retraces 12% to 35% from the prior high, though corrections up to 50% can still produce valid patterns in severe bear markets
-
The decline should occur in an orderly fashion rather than through a single panic-driven collapse
-
The bottom of the cup should be rounded, showing price stabilizing and basing over multiple weeks rather than a sharp V-shaped reversal
-
Volume often decreases during the bottom formation as selling pressure exhausts
-
The right side recovery should mirror the left side decline roughly, creating symmetry in the overall cup shape
-
Price should recover to within a few percentage points of the prior high before the handle begins forming
-
The entire cup formation typically takes seven weeks at minimum, with many quality patterns taking three to six months or longer
-
Cups that form too quickly often lack the accumulation depth needed for sustained breakouts
-
The cup's high points on left and right sides create a resistance level that becomes the eventual breakout trigger
Depth and Duration Considerations
The depth and duration of the cup directly affect the pattern's reliability and the size of the potential move following a breakout.
Shallower cups that correct 12% to 20% generally indicate stronger stocks with more institutional support—these names don't fall as far during market corrections because buyers step in earlier. Deeper cups correcting 30% to 50% can still work but require more recovery effort and may indicate weaker underlying demand. O'Neil's research suggested that the best cup and handle patterns form in leading stocks that correct less than the broader market during downturns. Duration matters because proper accumulation takes time. A cup that forms in three to four weeks hasn't allowed enough time for weak holders to exit and strong hands to accumulate. Patterns taking seven weeks to several months allow this ownership transfer to occur naturally. However, extremely extended cups lasting multiple years can lose their significance as the original context that created the pattern becomes stale. The ideal cup balances sufficient depth to shake out weak holders with controlled duration that maintains the pattern's relevance.
Keep In Mind: The cup portion of the cup and handle pattern requires proper depth (typically 12% to 35% correction), adequate duration (minimum seven weeks, often several months), and a rounded U-shape that reflects genuine accumulation rather than V-shaped panic selling and recovery—and evaluating these characteristics helps distinguish high-probability setups from patterns that look similar but lack structural integrity.
Anatomy of the Handle

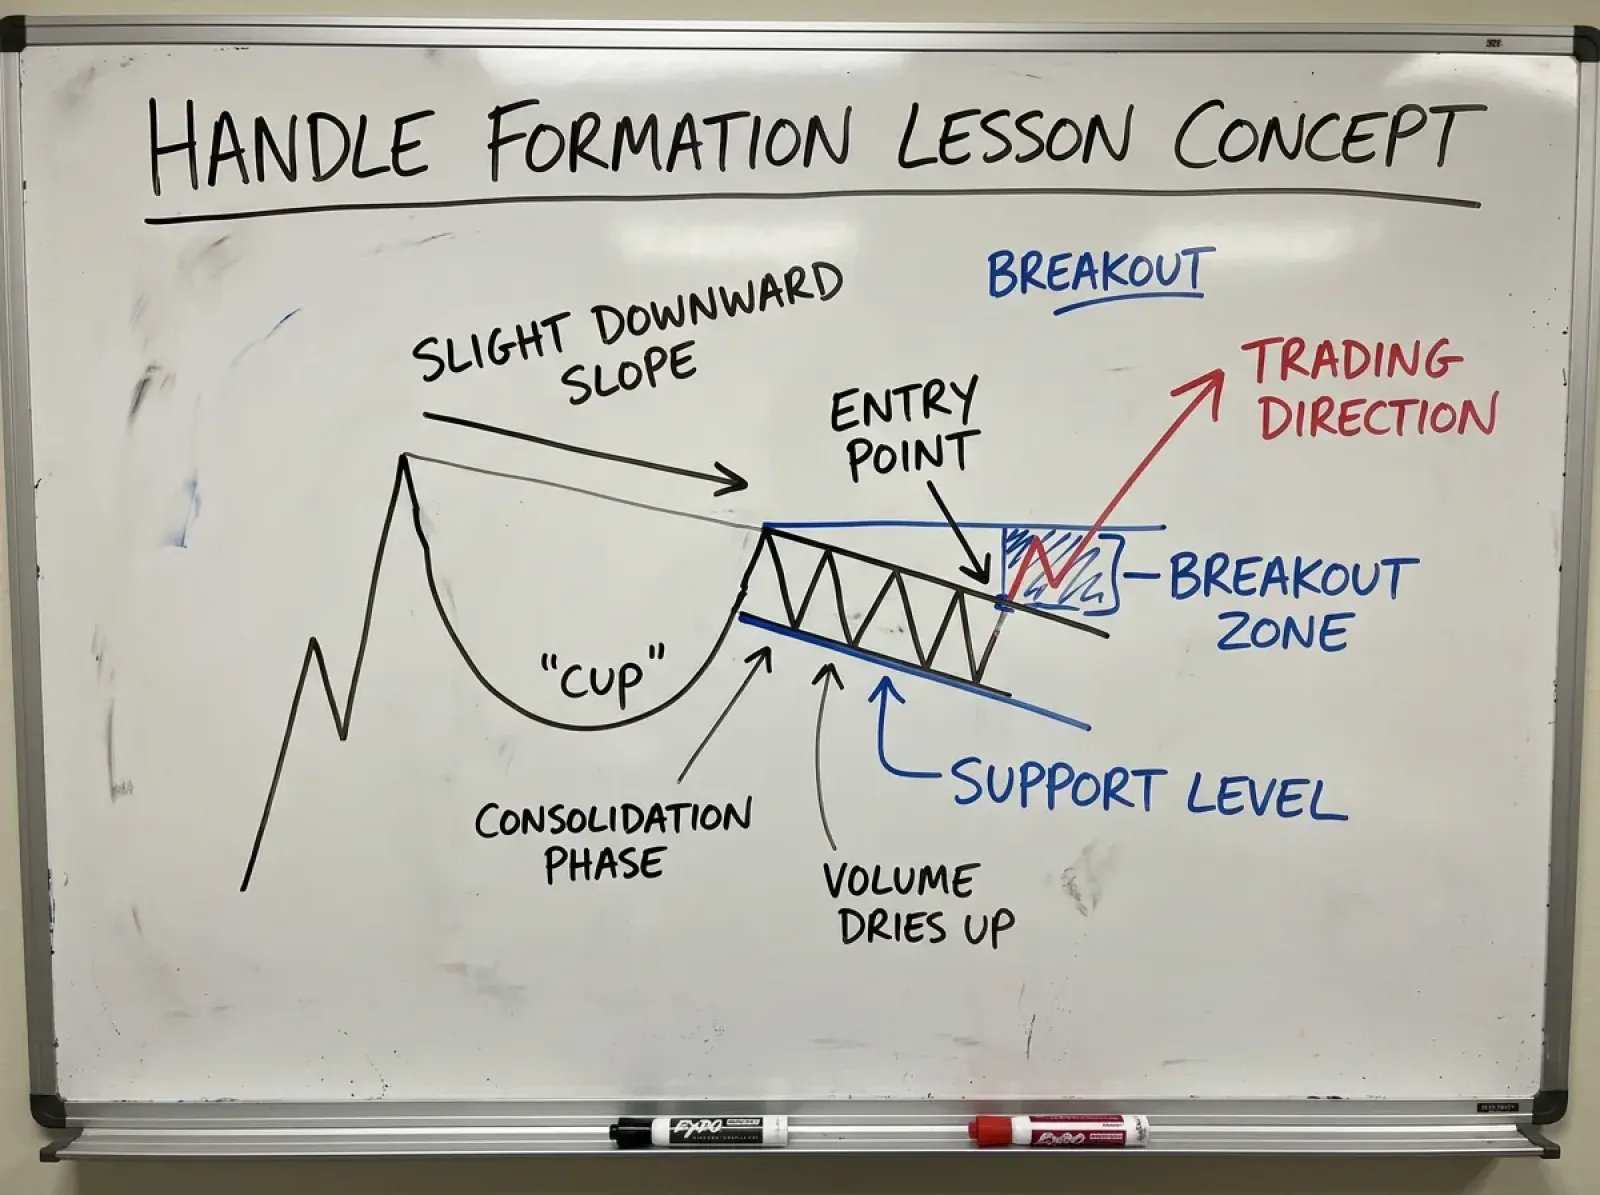
The handle is the finishing touch that distinguishes a cup and handle pattern from a simple rounded bottom or basing formation. After the cup completes and price approaches the prior high, the stock pauses rather than immediately breaking out. This consolidation phase—the handle—represents a final shakeout of remaining weak holders and allows the stock to digest gains from the cup's right side rally. The handle typically drifts slightly downward or sideways, contracting in both price range and volume, before price breaks out above resistance to trigger the pattern's completion.
Ideal Handle Characteristics
The best handles share specific characteristics that distinguish high-probability setups from sloppy consolidations that may fail on breakout attempts.
What makes a handle high quality:
-
The handle forms in the upper portion of the overall pattern, ideally in the upper third or upper half of the cup's range
-
Price drifts downward along a slight downtrend or moves sideways in a tight range
-
The handle should be smaller than the cup in both depth and duration—it's a minor consolidation, not a second major correction
-
Volume contracts during handle formation, indicating supply is drying up rather than aggressive selling
-
The handle typically lasts one to several weeks, though very large patterns may have handles lasting a month or more
-
Tight, controlled price action during the handle suggests institutional accumulation is absorbing available supply
-
The handle's low point should hold above the cup's midpoint, and ideally above the upper third of the cup's range
-
Handles that undercut their lows and recover can still work but show less constructive price action than those holding support cleanly
-
The handle should respect logical support levels such as moving averages or prior swing points within the cup
Handle Depth Relative to Cup
The relationship between handle depth and cup depth provides important information about whether the pattern retains structural integrity or has suffered too much technical damage.
O'Neil's guidelines suggest the handle should retrace no more than one-third to one-half of the cup's depth. If the cup corrected 30% from peak to trough, the handle should ideally pull back no more than 10% to 15% from the cup's right side high. Deeper handles that drop into the lower half of the cup suggest that demand hasn't fully overcome supply, meaning the breakout attempt may fail or lack follow-through. Shallow handles that barely retrace before breaking out indicate exceptional strength and urgent buying, though they can also fail if the consolidation period is too brief. The handle's position within the cup matters as much as its absolute depth—a handle holding in the upper third of the cup shows buyers unwilling to let price fall far, while a handle dropping into the lower half shows sellers still capable of pushing price significantly lower.
Duration of the Handle
Handle duration affects both the reliability of the pattern and the timing of your entry, with handles that form too quickly or too slowly both presenting concerns.
IF the handle forms over just a few days with minimal price contraction... THEN the consolidation may be insufficient to shake out weak holders, potentially leading to a failed breakout or quick reversal.
IF the handle forms over one to four weeks with declining volume and tightening price range... THEN this represents ideal consolidation that prepares the pattern for a strong breakout attempt.
IF the handle extends beyond four to five weeks and begins to look like a second cup... THEN the pattern is morphing into something else and may lose its cup and handle characteristics.
IF the handle shows persistent high volume during its formation... THEN sellers remain active and the pattern may need more time to absorb supply before a valid breakout.
IF the handle tightens dramatically in the final days before breakout with volume drying up almost completely... THEN supply has been fully absorbed and even modest buying pressure can trigger the breakout.
Think of it this way: The handle in the cup and handle pattern serves as the final consolidation that shakes out remaining weak holders before breakout—it should be proportionally smaller than the cup in both depth and duration, form in the upper portion of the pattern with contracting volume, and complete within one to several weeks to maintain the pattern's structural integrity and timing relevance.
Identifying Valid Cup and Handle Patterns


Not every U-shaped formation with a small consolidation qualifies as a legitimate cup and handle pattern. The difference between valid patterns and imposters often determines whether your breakout trades succeed or fail. Learning to distinguish high-probability setups from superficially similar formations protects your capital from false signals and focuses your attention on patterns with genuine structural integrity. The identification process involves evaluating cup shape, handle characteristics, volume behavior, and the context of the prior trend.
Proper Cup Shape Versus V-Bottoms
The rounded U-shape of the cup isn't merely aesthetic—it reflects the gradual accumulation process that gives the pattern its predictive power.
How to distinguish proper cups from V-bottoms:
-
A proper cup shows price declining over multiple weeks, stabilizing at the bottom over additional weeks, then recovering over a similar timeframe
-
V-bottoms show sharp declines followed immediately by sharp recoveries, with little or no time spent basing at the bottom
-
The rounded bottom indicates that selling pressure exhausted gradually while patient buyers accumulated shares over time
-
V-bottoms often represent short-covering rallies or reflexive bounces that lack the foundation of genuine accumulation
-
Look for the cup's bottom to span at least several weeks, not just a few days
-
Symmetry between the left side decline and right side recovery suggests orderly accumulation rather than panic-driven volatility
-
Cups with multiple small support tests at the bottom often produce better breakouts than those with a single sharp low point
-
Some successful cups have slightly rounded V-shapes with brief basing periods, but purely V-shaped formations have lower success rates
-
The shape requirement becomes more forgiving in severe bear markets where even quality stocks experience sharp declines
Handle Positioning and Drift
Where the handle forms within the overall pattern and how it behaves during consolidation separates quality setups from weaker formations.
The handle should form near the highs of the cup, not deep within its structure. Ideally, the handle begins after the right side of the cup has recovered to within 5% to 15% of the prior high. The handle then drifts slightly lower along a gentle downward slope or moves sideways in a tight range. This downward drift shakes out final weak holders who purchased during the cup's right side rally and became discouraged by the failure to immediately break out. The slope of the handle matters—a steep decline indicates aggressive selling that weakens the pattern, while a gentle drift or sideways movement shows controlled consolidation.
DO look for handles forming in the upper third of the overall cup range.
DO favor handles that drift along a slight downtrend or hold sideways with tightening price action.
DO verify that the handle's lowest point holds above the cup's midpoint at minimum.
DON'T accept handles that plunge deep into the cup, erasing most of the right side rally.
DON'T ignore handles that spike upward and fail repeatedly, showing persistent overhead supply.
DON'T overlook handles that form over too long a period and begin developing their own distinct pattern characteristics.
Volume Characteristics and Prior Trend
Volume behavior throughout the pattern's formation and the existence of a prior uptrend provide confirmation that accumulation is genuine and the pattern qualifies as a continuation setup.
Volume should tell a specific story across the cup and handle pattern's development. During the left side decline, volume may expand as sellers take control. At the cup's bottom, volume should dry up as selling exhausts—low volume basing indicates weak holders have exited and remaining shareholders aren't eager to sell. During the right side recovery, volume should gradually increase as buyers return, showing renewed demand. In the handle, volume should contract again as the consolidation represents a pause rather than distribution.
On the breakout, volume should expand significantly, ideally 40% to 50% or more above average, confirming that buyers are committing capital to push through resistance. Without a prior uptrend, the pattern cannot qualify as a bullish continuation—it becomes a potential reversal pattern with different characteristics and success rates. Look for evidence that the stock was in an established uptrend before the cup's left side decline began, whether through higher highs and higher lows, price trading above rising moving averages, or clear momentum in the months preceding the pattern.
Trading the Breakout


Identifying a valid cup and handle pattern is only half the equation—executing the trade properly determines whether your analysis translates into profits. The breakout moment represents the pattern's culmination, when price pushes above resistance and confirms that buyers have finally overcome the overhead supply that created the cup's high points. Your entry timing, stop placement, and position sizing should all derive from the pattern's structure, giving you a systematic approach rather than arbitrary decision-making. The cup and handle pattern provides clear levels to work with, making trade planning straightforward once you understand how to use them.
Entry Point Identification
The breakout trigger occurs when price moves above the resistance level defined by the cup's highs and the handle's ceiling—this is your entry zone.
Entry approaches for cup and handle breakouts:
-
The classic entry triggers when price closes above the handle's high point, often called the pivot point or buy point
-
More aggressive traders enter intraday as price crosses the pivot, without waiting for a closing confirmation
-
More conservative traders wait for a close above the pivot, potentially with a follow-through day of additional gains
-
Some traders use a small buffer above the pivot (such as $0.10 or 0.5% above) to filter out false breakouts that barely pierce resistance
-
The handle's high point typically falls slightly below the cup's original high due to the handle's downward drift
-
Early entries within the handle carry more risk but offer better prices if the breakout succeeds
-
Buying on slight pullbacks after an initial breakout can provide secondary entry opportunities
-
Avoid chasing extended breakouts that have already moved 5% or more above the pivot—the risk-reward deteriorates rapidly
-
If the breakout fails and price falls back below the pivot, this negates the entry signal and suggests waiting for a new setup
Stop Loss Placement
The pattern's structure provides logical stop loss levels that define your risk before entering the trade.
The most common stop placement uses the handle's low point as your line in the sand. If price breaks out but then reverses and trades below the handle's low, the pattern has failed and your thesis is invalidated. This placement typically puts your stop 5% to 10% below your entry point, depending on how tight the handle formed. A tighter handle means a closer stop and more favorable risk-reward. Some traders use a slightly wider stop just below the handle's midpoint to avoid getting shaken out by minor volatility. Others use a stop below the cup's midpoint for very loose patterns, though this significantly increases risk per share. Whatever level you choose, the key is selecting it before entry and sizing your position accordingly. Never set your stop based on how much you're willing to lose in dollars—set it based on where the pattern's structure would be violated.
Position Sizing and Confirmation
Your position size should derive from your stop distance and your predetermined risk per trade, while confirmation signals help you gauge whether the breakout has genuine strength.
Position sizing based on pattern structure:
-
Calculate the distance from your entry to your stop loss as a percentage
-
Determine the dollar amount you're willing to risk on this trade based on your account size and risk tolerance
-
Divide your risk amount by the per-share risk (entry price minus stop price) to determine share quantity
-
Tighter handles with closer stops allow larger positions while risking the same dollar amount
-
Wider handles require smaller positions to maintain consistent risk per trade
-
Never override this calculation because you "really like" the pattern—discipline protects your capital
Confirmation signals that strengthen the breakout:
-
Volume on the breakout day expands to at least 40% to 50% above the 50-day average
-
Price closes in the upper portion of the day's range, showing buyers controlled the session
-
The breakout occurs in a favorable market environment rather than fighting broad market weakness
-
Related stocks in the same sector show similar strength or breakout patterns
-
The stock's relative strength compared to the market has been improving during handle formation
-
Institutional sponsorship is present, visible through accumulation ratings or fund ownership data
-
The broader market is in a confirmed uptrend rather than a correction or bear market
Remember: Trading the cup and handle pattern breakout requires a systematic approach—enter as price crosses the pivot point formed by the handle's high, set stops based on the pattern structure rather than arbitrary dollar amounts, size positions so that a stop-out results in an acceptable loss, and look for volume confirmation and favorable market conditions to increase confidence in the breakout's sustainability.
Measuring Price Targets


Every cup and handle pattern provides a built-in framework for estimating potential price targets based on the pattern's structure. While no target is guaranteed—stocks can exceed projections or fall short—having objective price levels helps you plan profit-taking, evaluate risk-reward before entry, and avoid the common mistake of either selling too early or holding too long. The measured move technique gives you a starting point derived from the pattern itself rather than arbitrary round numbers or wishful thinking.
The Measured Move Technique
The measured move projects a price target by adding the cup's depth to the breakout level, assuming the move following breakout will at least match the distance the stock traveled during cup formation.
How to calculate the measured move target:
-
Identify the cup's high point (the left side peak where the pattern began)
-
Identify the cup's low point (the bottom of the rounded formation)
-
Calculate the depth by subtracting the low from the high
-
Add this depth to the breakout point (typically the handle's high or the cup's right side high)
-
This sum represents your measured move price target
-
For example, if the cup's high was $50, the low was $40, and the breakout occurs at $49, the depth is $10 and the target is $59
-
Some traders use the percentage depth rather than the dollar depth, particularly for stocks at different price levels
-
The measured move represents a minimum expectation—strong breakouts in favorable markets often exceed this target
-
Reaching the measured move doesn't mean the stock must reverse, only that the pattern's initial projection has been fulfilled
Conservative Versus Aggressive Targets
Different traders use different target approaches based on their risk tolerance, trading style, and read of the broader market environment.
The measured move serves as a baseline, but you can adjust expectations based on pattern quality and market conditions.
IF the cup formed over many months with a tight handle and the breakout occurs on massive volume... THEN consider targeting 1.5 to 2 times the measured move, as high-quality patterns often produce extended runs.
IF the cup is relatively shallow with a looser handle and volume on breakout is only modestly above average... THEN use the standard measured move as your primary target and consider taking partial profits before reaching it.
IF the broader market is in a strong uptrend with improving breadth and leading stocks are working... THEN lean toward aggressive targets since favorable market conditions support extended moves.
IF the market environment is choppy or uncertain with many breakouts failing across the market... THEN use conservative targets and consider taking profits earlier than usual to protect gains.
IF the stock is a market leader with exceptional earnings growth and institutional accumulation... THEN the stock may significantly exceed measured move targets as fundamental support drives further appreciation.
IF the stock has a history of volatile moves with frequent reversals after breakouts... THEN scale out at multiple levels rather than waiting for a single aggressive target.
Quick tip: Consider taking partial profits at the measured move target—selling one-third to one-half of your position locks in gains while allowing remaining shares to capture any extended move beyond the initial projection.
Quick tip: Track the cup and handle pattern's progress using the 21-day exponential moving average as a trailing guide—as long as the stock holds above this average on pullbacks following breakout, the move remains intact regardless of specific price targets.
Cup and Handle Variations


The classic cup and handle pattern has several variations that traders encounter across different timeframes and market conditions. Some variations maintain the bullish thesis while modifying specific elements. Others flip the pattern entirely to signal bearish outcomes. Understanding these variations expands your pattern recognition beyond the textbook form and helps you identify opportunities—or risks—that others might miss.
Common variations of the cup and handle pattern:
-
Cup with no handle occurs when price breaks out directly from the right side of the cup without forming a consolidation phase, often in strongly trending stocks with urgent buying pressure
-
These handleless breakouts can work but lack the final shakeout that typically improves follow-through
-
Cups without handles often occur in market leaders during powerful bull moves when buyers don't allow any consolidation
-
The breakout point for a handleless cup is simply the cup's prior high rather than a handle pivot
-
Multi-year cup formations develop on monthly or quarterly charts, taking two to ten years or longer to complete
-
These secular patterns precede major long-term moves but require exceptional patience to trade
-
Multi-year cups often form after major bear markets as stocks gradually rebuild over years
-
Intraday cup and handle patterns form on hourly, fifteen-minute, or five-minute charts for day traders
-
These compressed patterns require faster execution and tighter risk management
-
Intraday versions follow the same structural principles but complete in hours rather than months
-
The inverted cup and handle is a bearish reversal pattern that mirrors the bullish version upside down
-
Inverted patterns form when price rallies to a high, rounds over into a dome-shaped top, declines to the prior low, consolidates in an upward-drifting handle, then breaks down
-
The breakdown triggers short entries with measured move targets calculated below the breakdown point
The Inverted Cup and Handle
The bearish inverted version flips every element of the classic pattern, creating a rounded top followed by a brief upward-drifting consolidation before price breaks down.
Where the bullish cup and handle represents accumulation and continuation of an uptrend, the inverted version represents distribution and continuation of a downtrend. The inverted cup forms a dome or arch shape as price rounds over from a high. The inverted handle drifts upward slightly, shaking out shorts and trapping late longs before the breakdown confirms. Entry triggers when price breaks below the handle's low point, with stops above the handle's high and measured move targets projecting downward. The inverted cup and handle pattern appears less frequently than its bullish counterpart but provides high-probability short setups when properly identified in declining markets.
Did You Know? William O'Neil's original research focused exclusively on the bullish cup and handle pattern for growth stock investing, and he did not emphasize the inverted bearish version—the inverted cup and handle gained recognition later as traders applied the pattern's logic to short selling and bearish markets.
Did You Know? Some of the largest stock market winners in history formed cup and handle patterns lasting one to two years before their biggest advances, including many technology stocks in the late 1990s and leading growth stocks throughout various bull market cycles.
Common Cup and Handle Mistakes


The cup and handle pattern's popularity creates its own problem: traders see cups and handles everywhere, forcing the pattern onto formations that don't qualify. This eagerness to find setups leads to trades on weak patterns that fail more often than they succeed. Beyond pattern identification errors, execution mistakes—premature entries, poorly placed stops, ignoring context—further erode results. Understanding the most common mistakes helps you avoid joining the crowd of traders who wonder why a "reliable" pattern keeps failing them.
Common mistakes that undermine cup and handle trading:
-
Forcing the pattern onto any U-shaped formation regardless of proper depth, duration, or shape characteristics
-
Seeing cup and handle patterns in V-bottoms that lack the rounded accumulation base the pattern requires
-
Identifying cups in stocks that never had a prior uptrend, making the formation a potential bottoming pattern rather than a continuation setup
-
Entering before the handle completes, buying during the consolidation rather than waiting for the breakout trigger
-
Jumping in as the handle begins forming, assuming the breakout is imminent when weeks of consolidation may remain
-
Ignoring volume characteristics, particularly buying breakouts that occur on weak volume without institutional participation
-
Setting stops too tight based on dollar amounts rather than pattern structure, getting stopped out by normal volatility
-
Setting stops below arbitrary support levels instead of the handle's low where the pattern actually fails
-
Chasing extended breakouts that have already moved 5% to 10% or more above the pivot point
-
Ignoring the broader market environment and buying breakouts during market corrections when most breakouts fail
-
Using the same position size regardless of handle tightness, over-concentrating in loose patterns with wide stops
-
Abandoning the pattern after one or two failures rather than evaluating whether the failures resulted from pattern selection or market conditions
-
Focusing exclusively on the pattern while ignoring fundamental quality of the underlying stock
-
Expecting every valid pattern to work, rather than accepting that even high-probability setups fail a meaningful percentage of the time
-
Holding through breakout failures hoping the stock will recover rather than honoring stops and preserving capital
The Context Problem
Many cup and handle failures stem not from the pattern itself but from ignoring the context in which it forms—market environment, sector strength, and the stock's fundamental quality all affect breakout success rates.
A textbook cup and handle pattern in a declining market or weak sector faces headwinds that even perfect structure cannot overcome. Breakouts work best when the broader market is in a confirmed uptrend, when the stock's sector shows relative strength, and when the company demonstrates the earnings growth or other fundamental characteristics that attract institutional buying. Trading patterns in isolation, without considering these contextual factors, produces inconsistent results and frustration. The cup and handle pattern increases your odds when properly identified and traded—it doesn't guarantee success regardless of environment.
The Bottom Line: The most common cup and handle pattern mistakes involve forcing the pattern onto formations that don't qualify, entering before the handle completes and the breakout triggers, ignoring volume confirmation and prior trend requirements, setting stops based on arbitrary levels rather than pattern structure, and trading without regard for broader market context—avoiding these errors separates traders who profit from the pattern from those who blame the pattern for their own mistakes.
Putting the Cup and Handle Pattern to Work


The cup and handle pattern has earned its place among the most respected technical setups because it combines clear visual structure with sound market psychology. The rounded cup reflects genuine accumulation over time. The handle represents a final shakeout before commitment. The breakout marks the moment when demand overwhelms the last of the overhead supply. Each phase serves a purpose, and understanding that purpose helps you evaluate whether a forming pattern has the characteristics that produce successful breakouts. The pattern won't work every time—no pattern does—but properly identified cup and handle setups in favorable market conditions offer a reliable framework for capturing continuation moves in trending stocks.
Building Pattern Recognition Over Time
Mastering the cup and handle pattern requires patience both in waiting for patterns to develop and in building your own skill through accumulated experience.
The best cup and handle patterns take months to form, which means opportunities don't appear constantly. Rushing to trade every formation that vaguely resembles the pattern leads to forcing trades on weak setups that fail. Instead, maintain watchlists of stocks forming potential cups and handles, tracking their development over weeks without feeling compelled to act prematurely. Let the pattern come to you rather than chasing it. When valid patterns do complete and break out on volume in favorable market environments, execute with confidence because you've done the work to verify the setup. Over time, you'll develop intuition for which patterns have the structural integrity and contextual support that produce winners. You'll also learn to recognize the subtle differences between high-probability setups and patterns that merely look similar on the surface. This pattern recognition skill compounds with experience, making the cup and handle pattern increasingly valuable as one component of a broader technical approach.
