Essential Guide to Japanese Candlesticks

Candlestick Patterns Cheat Sheet

Tobi Frenzen
Author
Tobi Frenzen
Published
October 31, 2024
Updated
April 26, 2025
Author
Tobi Frenzen
Published
Oct 31, 2024
Updated
Apr 26, 2025
Enhance your trading with our comprehensive and interactive cheatsheet of Japanese candlestick patterns. Learn to identify key single, double, and triple candle formations that signal potential market reversals or continuations. Understand their appearances, typical locations, and implications to make more informed trading decisions.
Bullish Candle
Candlestick Elements
Bullish Candle with OHLC Elements Annotated

Anatomy of a Bullish Candlestick

Candlestick Pattern Cheat Sheet
A bullish (green) candlestick indicates upward price movement, where the closing price is higher than the opening price, suggesting buyer control. The candlestick’s body shows the open-to-close range, with a longer body signaling strong buying momentum. Wicks (shadows) above and below the body display the period's high and low prices; a long upper wick suggests seller resistance, while a long lower wick suggests buyer support.

Basic Elements of a Bullish Candle

  • Real Body
    The rectangle showing open-to-close price range
  • Upper Wick
    The line above shows the highest price
  • Lower Wick
    The line below shows the lowest price
  • Color
    Green/white, signifying up moves
Bullish Candle Diagram

Bullish Candle Diagram

Bearish Candle
Candlestick Elements
Bearish Candle with OHLC Elements Annotated

Anatomy of a Bearish Candlestick

Candlestick Pattern Cheat Sheet
A bearish (red) candlestick signals downward price movement, where the closing price is lower than the opening price, showing seller dominance. The body represents the open-to-close range, with a longer body indicating strong selling pressure. Wicks (shadows) above and below the body display the period's high and low prices; a long upper wick suggests buyers attempted to push higher but failed, while a long lower wick suggests sellers met buyer support.

Basic Elements of a Bearish Candle

  • Real Body
    The rectangle showing open-to-close price range
  • Upper Wick
    The line above shows the highest price
  • Lower Wick
    The line below shows the lowest price
  • Color
    Red/black, signifying down moves
Bearish Candle Diagram

Bearish Candle Diagram

    Candlestick Patterns

    Interactive Cheat Sheet
    Use the filters to sort or narrow down your selection. Click any pattern to learn about its meaning and underlying psychology, or download our free poster for reference.
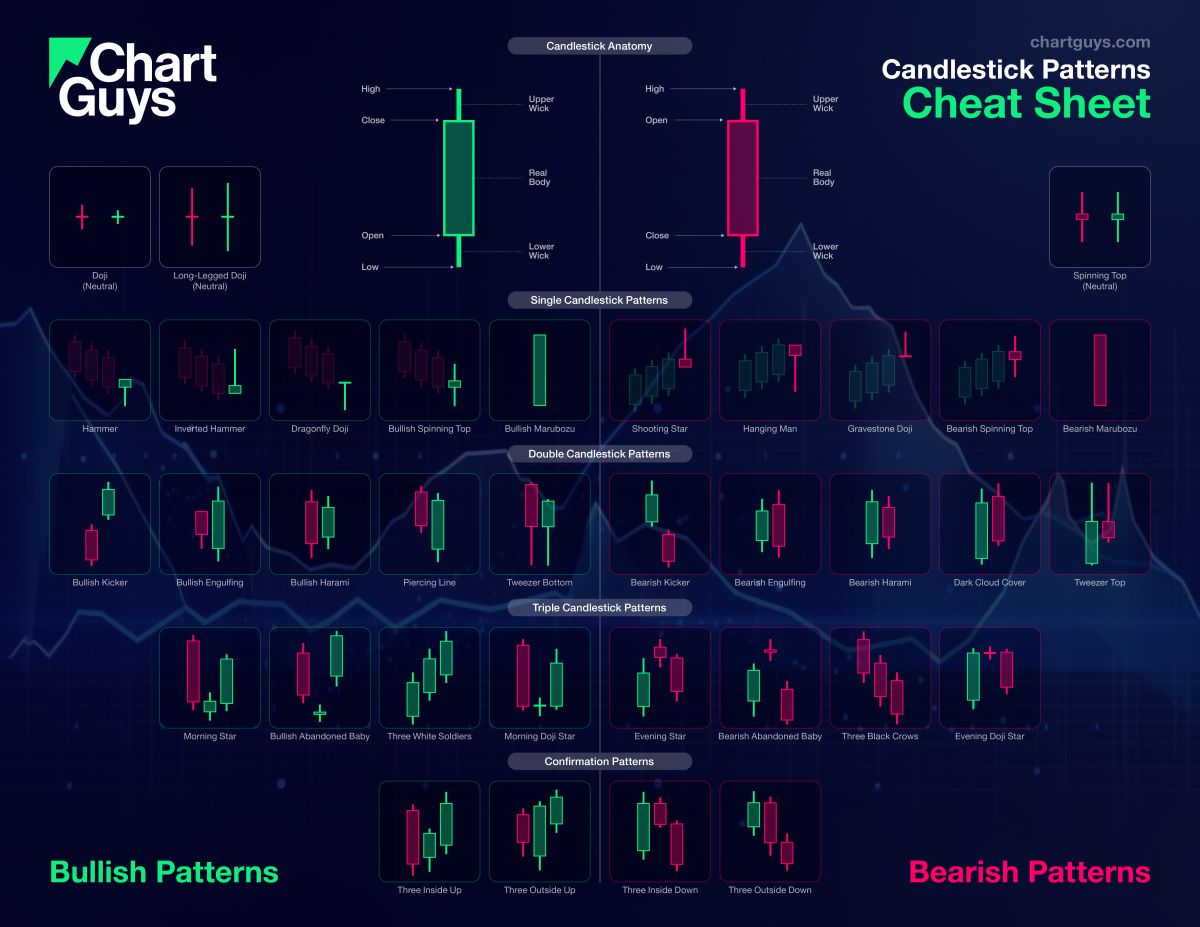
    Candlestick Patterns Cheat Sheet Poster - The Chart Guys

    Free Candlestick Patterns Cheat Sheet

    Downloadable Worksheet

    Grab your free comprehensive Candlestick Pattern Cheat Sheet as a downloadable poster for easy reference on key trading signals!

    Perfect for beginners and pros alike, this guide covers essential candlestick patterns, helping you make informed trading decisions anytime, anywhere.

    Doji - Neutral Single Candlestick Pattern
    Neutral
    Single Candlestick Pattern
    Doji

    Doji

    Japanese Candlestick Pattern
    • Bias:

      Neutral
    • Type:

      Single Candlestick Pattern

    Description

    Candle with open and close nearly equal, showing a cross-like shape.

    Meaning

    Indicates market indecision or balance. Found during trends and may signal a reversal or continuation based on context.
    Long-Legged Doji - Neutral Single Candlestick Pattern
    Neutral
    Single Candlestick Pattern
    Long-Legged Doji

    Long-Legged Doji

    Japanese Candlestick Pattern
    • Bias:

      Neutral
    • Type:

      Single Candlestick Pattern

    Description

    Long upper and lower wicks with a small or nonexistent body. The open and close prices are nearly identical.

    Meaning

    The prominent wicks indicate volatility. Buyers and sellers pushed prices in opposite directions throughout the session, ultimately reaching an indecisive close.
    Spinning Top - Neutral Single Candlestick Pattern
    Neutral
    Single Candlestick Pattern
    Spinning Top

    Spinning Top

    Japanese Candlestick Pattern
    • Bias:

      Neutral
    • Type:

      Single Candlestick Pattern

    Description

    Candle with a small body and long upper and lower wicks.

    Meaning

    Shows indecision between buyers and sellers. Common in both up and downtrends; signals potential reversal or pause.
    Hammer - Bullish Single Candlestick Pattern
    Bullish
    Single Candlestick Pattern
    Hammer

    Hammer

    Japanese Candlestick Pattern
    • Bias:

      Bullish
    • Type:

      Single Candlestick Pattern

    Description

    Small body with a long lower wick at the bottom of a downtrend.

    Meaning

    Showing rejection of lower prices. Signals potential bullish reversal, especially if followed by strong buying candles.
    Inverted Hammer - Bullish Single Candlestick Pattern
    Bullish
    Single Candlestick Pattern
    Inverted Hammer

    Inverted Hammer

    Japanese Candlestick Pattern
    • Bias:

      Bullish
    • Type:

      Single Candlestick Pattern

    Description

    Small body with a long upper wick at the bottom of a downtrend.

    Meaning

    Showing rejection of higher prices. Can signal bullish reversal if confirmed by subsequent buying pressure.
    Dragonfly Doji - Bullish Single Candlestick Pattern
    Bullish
    Single Candlestick Pattern
    Dragonfly Doji

    Dragonfly Doji

    Japanese Candlestick Pattern
    • Bias:

      Bullish
    • Type:

      Single Candlestick Pattern

    Description

    Candle with no upper wick and a long lower wick, resembling a "T" shape.

    Meaning

    Found in downtrends; suggests possible bullish reversal if confirmed by a strong upward move.
    Bullish Spinning Top - Bullish Single Candlestick Pattern
    Bullish
    Single Candlestick Pattern
    Bullish Spinning Top

    Bullish Spinning Top

    Japanese Candlestick Pattern
    • Bias:

      Bullish
    • Type:

      Single Candlestick Pattern

    Description

    Small body with wicks on both sides in a downtrend.

    Meaning

    Leaning bullish. Indicates indecision, but a potential reversal if followed by strong buying activity.
    Bullish Marubozu - Bullish Single Candlestick Pattern
    Bullish
    Single Candlestick Pattern
    Bullish Marubozu

    Bullish Marubozu

    Japanese Candlestick Pattern
    • Bias:

      Bullish
    • Type:

      Single Candlestick Pattern

    Description

    Large bullish candle without wicks.

    Meaning

    Showing complete buying control. Found in uptrends or at reversal points; indicates strong buying pressure and likely continuation of the trend.
    Shooting Star - Bearish Single Candlestick Pattern
    Bearish
    Single Candlestick Pattern
    Shooting Star

    Shooting Star

    Japanese Candlestick Pattern
    • Bias:

      Bearish
    • Type:

      Single Candlestick Pattern

    Description

    Small body with a long upper wick at the top of an uptrend.

    Meaning

    Indicating rejection of higher prices. Signals a potential bearish reversal if followed by selling pressure.
    Hanging Man - Bearish Single Candlestick Pattern
    Bearish
    Single Candlestick Pattern
    Hanging Man

    Hanging Man

    Japanese Candlestick Pattern
    • Bias:

      Bearish
    • Type:

      Single Candlestick Pattern

    Description

    Small body with a long lower wick at the top of an uptrend, resembling a hammer but bearish.

    Meaning

    Signals potential bearish reversal if confirmed by selling candles afterward.
    Gravestone Doji - Bearish Single Candlestick Pattern
    Bearish
    Single Candlestick Pattern
    Gravestone Doji

    Gravestone Doji

    Japanese Candlestick Pattern
    • Bias:

      Bearish
    • Type:

      Single Candlestick Pattern

    Description

    Long upper wick and no lower wick.

    Meaning

    Showing rejection of higher prices. Found in uptrends; signals potential bearish reversal if followed by selling activity.
    Bearish Spinning Top - Bearish Single Candlestick Pattern
    Bearish
    Single Candlestick Pattern
    Bearish Spinning Top

    Bearish Spinning Top

    Japanese Candlestick Pattern
    • Bias:

      Bearish
    • Type:

      Single Candlestick Pattern

    Description

    Small body with wicks in an uptrend, slightly leaning bearish.

    Meaning

    Indicates indecision with a bearish tilt, and may signal reversal if followed by selling.
    Bearish Marubozu - Bearish Single Candlestick Pattern
    Bearish
    Single Candlestick Pattern
    Bearish Marubozu

    Bearish Marubozu

    Japanese Candlestick Pattern
    • Bias:

      Bearish
    • Type:

      Single Candlestick Pattern

    Description

    Large bearish candle without wicks.

    Meaning

    Showing strong selling pressure. Found in downtrends; signals continuation of the bearish trend or an intensifying sell-off.
    Bullish Kicker - Bullish Double Candlestick Pattern
    Bullish
    Double Candlestick Pattern
    Bullish Kicker

    Bullish Kicker

    Japanese Candlestick Pattern
    • Bias:

      Bullish
    • Type:

      Double Candlestick Pattern

    Description

    Sharp bullish reversal where a strong bullish candle follows a bearish candle, with no overlap.

    Meaning

    Found after downtrends or sell-offs; suggests a sudden shift in sentiment, indicating strong buying interest and potential trend reversal.
    Bullish Engulfing - Bullish Double Candlestick Pattern
    Bullish
    Double Candlestick Pattern
    Bullish Engulfing

    Bullish Engulfing

    Japanese Candlestick Pattern
    • Bias:

      Bullish
    • Type:

      Double Candlestick Pattern

    Description

    A large bullish candle fully engulfs the previous smaller bearish candle.

    Meaning

    Typically found in downtrends, this pattern signals a potential bullish reversal as buyers overpower sellers, often indicating a shift toward upward momentum.
    Bullish Harami - Bullish Double Candlestick Pattern
    Bullish
    Double Candlestick Pattern
    Bullish Harami

    Bullish Harami

    Japanese Candlestick Pattern
    • Bias:

      Bullish
    • Type:

      Double Candlestick Pattern

    Description

    A small bullish candle forms within the previous larger bearish candle’s body.

    Meaning

    Seen in downtrends, it suggests indecision, with possible bullish reversal if the following candles confirm buying strength, indicating a weakening bearish trend.
    Piercing Line - Bullish Double Candlestick Pattern
    Bullish
    Double Candlestick Pattern
    Piercing Line

    Piercing Line

    Japanese Candlestick Pattern
    • Bias:

      Bullish
    • Type:

      Double Candlestick Pattern

    Description

    A bullish candle opens below and closes more than halfway into the prior bearish candle.

    Meaning

    Found in downtrends, this pattern suggests a possible bullish reversal if buying continues, as sellers lose control to buyers.
    Tweezer Bottom - Bullish Double Candlestick Pattern
    Bullish
    Double Candlestick Pattern
    Tweezer Bottom

    Tweezer Bottom

    Japanese Candlestick Pattern
    • Bias:

      Bullish
    • Type:

      Double Candlestick Pattern

    Description

    Two candles with matching or nearly matching lows, typically one bearish and one bullish.

    Meaning

    Found in downtrends, it signals potential reversal, showing strong support at the matching low, suggesting buyers are stepping in.
    Bearish Kicker - Bearish Double Candlestick Pattern
    Bearish
    Double Candlestick Pattern
    Bearish Kicker

    Bearish Kicker

    Japanese Candlestick Pattern
    • Bias:

      Bearish
    • Type:

      Double Candlestick Pattern

    Description

    Sharp bearish reversal where a strong bearish candle follows a bullish candle, with no overlap.

    Meaning

    Found after uptrends; indicates a sudden sentiment shift, signaling potential trend reversal and intensified selling pressure.
    Bearish Engulfing - Bearish Double Candlestick Pattern
    Bearish
    Double Candlestick Pattern
    Bearish Engulfing

    Bearish Engulfing

    Japanese Candlestick Pattern
    • Bias:

      Bearish
    • Type:

      Double Candlestick Pattern

    Description

    A large bearish candle fully engulfs the previous smaller bullish candle.

    Meaning

    Typically found in uptrends, this pattern signals a potential bearish reversal as sellers overpower buyers, often indicating a downward momentum shift.
    Bearish Harami - Bearish Double Candlestick Pattern
    Bearish
    Double Candlestick Pattern
    Bearish Harami

    Bearish Harami

    Japanese Candlestick Pattern
    • Bias:

      Bearish
    • Type:

      Double Candlestick Pattern

    Description

    A small bearish candle forms within the previous larger bullish candle’s body.

    Meaning

    Seen in uptrends, it suggests indecision with a potential bearish reversal if following candles confirm, indicating a weakening bullish trend.
    Dark Cloud Cover - Bearish Double Candlestick Pattern
    Bearish
    Double Candlestick Pattern
    Dark Cloud Cover

    Dark Cloud Cover

    Japanese Candlestick Pattern
    • Bias:

      Bearish
    • Type:

      Double Candlestick Pattern

    Description

    A bearish candle opens above and closes more than halfway into the previous bullish candle.

    Meaning

    Found in uptrends; signals potential bearish reversal if selling continues, as buyers lose control to sellers.
    Tweezer Top - Bearish Double Candlestick Pattern
    Bearish
    Double Candlestick Pattern
    Tweezer Top

    Tweezer Top

    Japanese Candlestick Pattern
    • Bias:

      Bearish
    • Type:

      Double Candlestick Pattern

    Description

    Two candles with matching or nearly matching highs, typically one bullish and one bearish.

    Meaning

    Found in uptrends, it signals potential reversal, showing strong resistance at the matching high, suggesting selling pressure.
    Morning Star - Bullish Triple Candlestick Pattern
    Bullish
    Triple Candlestick Pattern
    Morning Star

    Morning Star

    Japanese Candlestick Pattern
    • Bias:

      Bullish
    • Type:

      Triple Candlestick Pattern

    Description

    Three candles with a bearish, small-bodied middle, and bullish candle.

    Meaning

    Found in downtrends; signals potential bullish reversal as buyers gain control, with strength confirmed by the third candle closing above the first.
    Bullish Abandoned Baby - Bullish Triple Candlestick Pattern
    Bullish
    Triple Candlestick Pattern
    Bullish Abandoned Baby

    Bullish Abandoned Baby

    Japanese Candlestick Pattern
    • Bias:

      Bullish
    • Type:

      Triple Candlestick Pattern

    Description

    Three candles with a bearish, gapped doji, and bullish candle.

    Meaning

    Appears in downtrends; suggests a strong bullish reversal, as the middle doji shows indecision, with confirmation by a strong bullish move.
    Three White Soldiers - Bullish Triple Candlestick Pattern
    Bullish
    Triple Candlestick Pattern
    Three White Soldiers

    Three White Soldiers

    Japanese Candlestick Pattern
    • Bias:

      Bullish
    • Type:

      Triple Candlestick Pattern

    Description

    Three consecutive bullish candles with higher closes each day.

    Meaning

    Found in downtrends; signals potential trend reversal, showing sustained buying strength, often signaling the start of a bullish trend.
    Morning Doji Star - Bullish Triple Candlestick Pattern
    Bullish
    Triple Candlestick Pattern
    Morning Doji Star

    Morning Doji Star

    Japanese Candlestick Pattern
    • Bias:

      Bullish
    • Type:

      Triple Candlestick Pattern

    Description

    Three candles with a bearish, doji, and bullish candle.

    Meaning

    Appears in downtrends; signals potential bullish reversal, with indecision from the doji and confirmation by a strong bullish candle.
    Evening Star - Bearish Triple Candlestick Pattern
    Bearish
    Triple Candlestick Pattern
    Evening Star

    Evening Star

    Japanese Candlestick Pattern
    • Bias:

      Bearish
    • Type:

      Triple Candlestick Pattern

    Description

    Three candles with a bullish, small-bodied middle, and bearish candle.

    Meaning

    Found in uptrends; signals potential bearish reversal as sellers gain control, confirmed if the third candle closes below the first.
    Bearish Abandoned Baby - Bearish Triple Candlestick Pattern
    Bearish
    Triple Candlestick Pattern
    Bearish Abandoned Baby

    Bearish Abandoned Baby

    Japanese Candlestick Pattern
    • Bias:

      Bearish
    • Type:

      Triple Candlestick Pattern

    Description

    Three candles with a bullish, gapped doji, and bearish candle.

    Meaning

    Appears in uptrends; indicates strong bearish reversal, as indecision in the doji is followed by selling strength.
    Three Black Crows - Bearish Triple Candlestick Pattern
    Bearish
    Triple Candlestick Pattern
    Three Black Crows

    Three Black Crows

    Japanese Candlestick Pattern
    • Bias:

      Bearish
    • Type:

      Triple Candlestick Pattern

    Description

    Three consecutive bearish candles with lower closes each day.

    Meaning

    Found in uptrends; signals potential bearish reversal, with sustained selling pressure often marking the start of a downtrend.
    Evening Doji Star - Bearish Triple Candlestick Pattern
    Bearish
    Triple Candlestick Pattern
    Evening Doji Star

    Evening Doji Star

    Japanese Candlestick Pattern
    • Bias:

      Bearish
    • Type:

      Triple Candlestick Pattern

    Description

    Three candles with a bullish, doji, and bearish candle.

    Meaning

    Appears in uptrends; signals potential bearish reversal, as the doji suggests indecision, confirmed by strong selling on the third candle.
    Three Inside Up - Bullish Confirmation Pattern
    Bullish
    Confirmation Pattern
    Three Inside Up

    Three Inside Up

    Japanese Candlestick Pattern
    • Bias:

      Bullish
    • Type:

      Confirmation Pattern

    Description

    Three candles with a bullish second candle within the first bearish one, followed by a third bullish candle.

    Meaning

    Found in downtrends; confirms potential bullish reversal, showing building buying pressure as the trend shifts upward.
    Three Outside Up - Bullish Confirmation Pattern
    Bullish
    Confirmation Pattern
    Three Outside Up

    Three Outside Up

    Japanese Candlestick Pattern
    • Bias:

      Bullish
    • Type:

      Confirmation Pattern

    Description

    Three candles with a second bullish candle engulfing the first bearish one, followed by a third bullish candle.

    Meaning

    Found in downtrends; signals a confirmed bullish reversal, as buyers gain control and sustain upward momentum.
    Three Inside Down - Bearish Confirmation Pattern
    Bearish
    Confirmation Pattern
    Three Inside Down

    Three Inside Down

    Japanese Candlestick Pattern
    • Bias:

      Bearish
    • Type:

      Confirmation Pattern

    Description

    Three candles with a bearish second candle within the first bullish one, followed by a third bearish candle.

    Meaning

    Found in uptrends; confirms potential bearish reversal, indicating weakening bullish pressure and a possible trend shift.
    Three Outside Down - Bearish Confirmation Pattern
    Bearish
    Confirmation Pattern
    Three Outside Down

    Three Outside Down

    Japanese Candlestick Pattern
    • Bias:

      Bearish
    • Type:

      Confirmation Pattern

    Description

    Three candles with a second bearish candle engulfing the first bullish one, followed by a third bearish candle.

    Meaning

    Found in uptrends; signals confirmed bearish reversal, as selling pressure dominates and momentum turns downward.
    Share this guide with someone who'll find it useful.

    Join The
    Chart Guys!

    To learn from other experienced traders and technical analysts, why not join our unique trading community? We can't wait to welcome you in our trading room to answer your questions and help you achieve your goals.

    Follow Us On Social Media