


The ADX Indicator: What It Really Measures


Most traders obsess over whether a stock is going up or down. But here's what they miss: knowing the direction means nothing if you don't know how strong that move actually is. The Average Directional Index—ADX for short—exists to answer one specific question: How much conviction is behind this trend?
What ADX Tells You (and What It Doesn't)
The ADX indicator measures trend strength on a scale from 0 to 100. That's it. Notice what's missing from that description: any mention of direction. The ADX doesn't care if price is climbing or falling. It only tells you whether buyers and sellers are committed to pushing in one direction, or if they're just halfheartedly shuffling the price around.
Here's what you get from ADX:
-
A reading of how strong the current trend is (or isn't)
-
Whether the market is trending at all or just moving sideways
-
Early warnings when a strong trend starts losing steam
-
Confirmation that a breakout has real momentum behind it
Here's what you don't get:
-
Which direction the trend is moving
-
Where price is headed next
-
Entry or exit signals on its own
-
Any guarantee about future price movement
The Origin Story
Back in 1978, a mechanical engineer turned technical analyst named J. Welles Wilder Jr. published a book called "New Concepts in Technical Trading Systems." Among several indicators he introduced, the ADX stood out because it solved a problem most traders didn't even know they had. Wilder noticed that traders spent all their energy figuring out if a market was bullish or bearish, but they largely ignored whether that bull or bear had any real strength. The ADX indicator changed that by giving traders a simple number that quantified trend strength—something that had always been more art than science.
Understanding the Basics
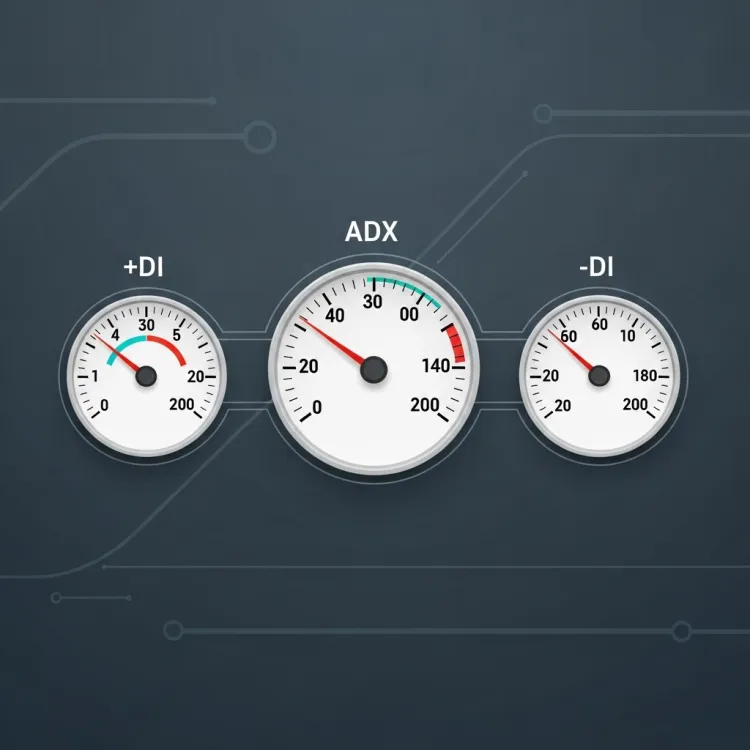

The ADX system actually consists of three separate lines working together. Think of them as a small team, each with a specific job. You've got the ADX line itself, plus two supporting players called the Plus Directional Indicator (+DI) and the Minus Directional Indicator (-DI).
-
ADX: Measures the strength of the trend, regardless of direction
-
+DI: Tracks upward price movement
-
-DI: Tracks downward price movement
What "Directional Movement" Actually Means
Directional movement isn't just about whether price went up or down today. Wilder defined it more carefully than that. The +DI measures the portion of today's range that exceeds yesterday's high—the part of the move that broke new ground to the upside. The -DI does the opposite, measuring how much of today's range pushed below yesterday's low. If today's price stayed completely within yesterday's range, you get zero directional movement. This approach filters out the noise and focuses on price action that's actually going somewhere.
How ADX Calculates Trend Strength
The math behind the ADX indicator involves smoothing and averaging these directional movements over a set period (usually 14 days). But you don't need to memorize the formula to use it effectively. What matters is understanding the output: a number between 0 and 100. Lower numbers mean the market is drifting without commitment. Higher numbers mean buyers and sellers have picked a side and they're pushing hard. The ADX rises when directional movement is consistent and strong. It falls when price chops around without making progress in either direction.
Common Misconceptions About ADX Readings
People new to the ADX indicator often make the same mistakes. Getting these cleared up now will save you from some frustrating trades later.
-
High ADX doesn't mean "buy": A reading of 60 tells you there's a strong trend, but it could be a strong downtrend. Check the DI lines for direction.
-
Low ADX doesn't mean "sell": Readings below 20 just mean there's no strong trend right now. The market might be consolidating before the next big move.
-
ADX can't predict reversals: It measures what's happening now, not what's coming next. A falling ADX after a strong trend might hint at weakening momentum, but it's not a reversal signal by itself.
-
The scale isn't percentage-based: An ADX of 50 doesn't mean the trend is "50% strong." The numbers are relative—compare current readings to recent history on the same chart.
The ADX indicator works best when you stop trying to make it do things it wasn't designed to do.
Reading ADX Values
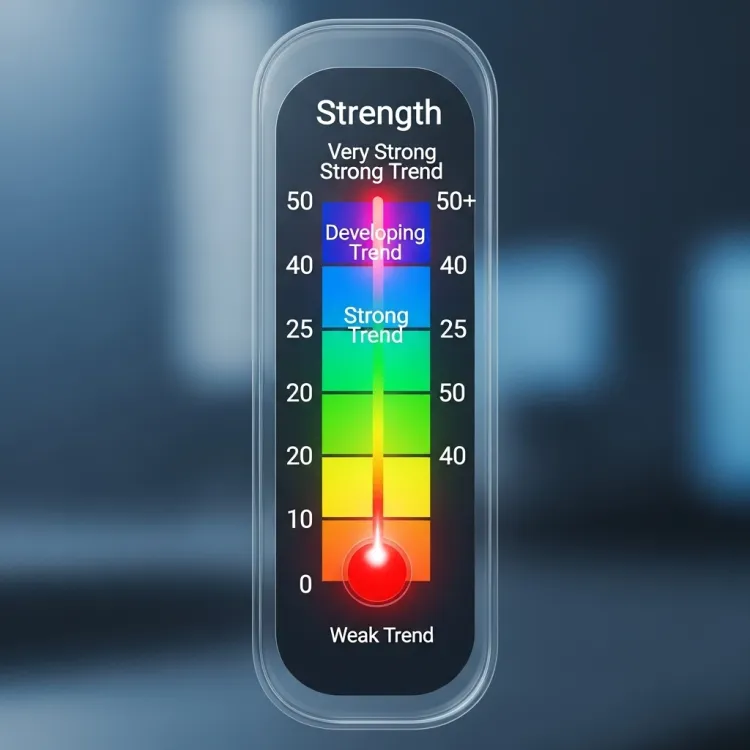

Think of the ADX like a speedometer, but instead of measuring how fast you're going, it measures how committed the market is to its current direction. The numbers themselves create natural zones that tell you what kind of market environment you're dealing with.
The ADX Scale Breakdown
Different readings on the ADX indicator tell different stories about what's happening beneath the surface of price action. Here's how to interpret the numbers you'll see:
-
Below 20: The market is either range-bound or trending so weakly that it barely qualifies as a trend. Price is probably bouncing between support and resistance without making real progress. Trend-following strategies struggle here. Some traders love these conditions for range-trading setups, but if you're hunting trends, you're better off waiting.
-
20-25: The transition zone where trends start showing signs of life. The market is beginning to pick a direction and stick with it. Not every reading in this range becomes a strong trend, but this is where you start paying closer attention. Think of it as the market clearing its throat before it speaks.
-
25-50: Now you've got a legitimate trend with real conviction behind it. This is where trend-following strategies shine. The market has chosen a direction and participants are committed. Most profitable trend trades happen when ADX sits in this range.
-
Above 50: You're looking at a very strong trend, the kind that makes headlines. But here's the catch—these extreme readings often show up late in a trend's life. The move might continue, or it might be running on fumes. High ADX above 50 can signal opportunity, but it can also mean you're arriving at the party just as everyone's getting ready to leave.
Why High ADX Doesn't Tell You Direction
Here's where people get tripped up constantly. An ADX reading of 45 sounds impressive, and it is—there's definitely a strong trend happening. But is it going up or down? The ADX has no opinion on that. It's measuring the strength of commitment, not the direction of travel. You could have two stocks both showing ADX readings of 40, with one in a raging uptrend and the other in a brutal downtrend. The ADX treats both situations identically because both show strong directional commitment. This is why you need to look at the +DI and -DI lines (which we'll cover next) or simply glance at the price chart itself to know which way the trend is actually pointing.
The Bottom Line: A high ADX tells you the market means business—it just doesn't tell you what kind of business it's in.
The +DI and -DI Lines

Remember how the ADX tells you about trend strength but stays silent on direction? That's where the Directional Indicator lines come in. The +DI and -DI work as a team with the ADX, filling in the missing piece of the puzzle. While the ADX measures conviction, these two lines tell you where that conviction is pointed.
How They Complement the ADX Reading
The relationship between these three lines gives you a complete picture of what's happening in the market. Here's how they work together:
-
High ADX + +DI above -DI: Strong uptrend with conviction. Buyers are in control and pushing with force.
-
High ADX + -DI above +DI: Strong downtrend with conviction. Sellers have the upper hand and they're not letting go.
-
Low ADX + Either DI line leading: Weak trend or no trend at all. The market is probably chopping sideways, and whichever DI line is on top doesn't mean much.
-
Rising ADX + DI lines separating: A trend is building steam. The gap between +DI and -DI is widening as one side gains dominance.
-
Falling ADX + DI lines converging: The trend is losing strength. Neither buyers nor sellers are maintaining their momentum.
Reading the Crossovers
The moments when +DI and -DI cross paths often mark shifts in market control. These crossovers become more meaningful when you combine them with what the ADX indicator is telling you.
-
Bullish Signal: When +DI crosses above -DI, buyers are taking charge. If this happens while ADX is rising from below 20, you might be catching a new trend early. If it happens with ADX already above 25, you've got confirmation that a strong uptrend is in motion.
-
Bearish Signal: When -DI crosses above +DI, sellers are taking over. Again, check the ADX level. A crossover with rising ADX above 20 suggests a downtrend is gaining traction. A crossover with ADX below 20 might just be noise in a sideways market.
Using Both Together for Confirmation
Smart traders don't trade the DI crossovers in isolation. They wait for the ADX to back up what the directional indicators are suggesting. Say +DI crosses above -DI—that's interesting, but is there real momentum behind it? If the ADX is below 20 and staying flat, that crossover probably won't lead anywhere meaningful. But if the ADX is climbing toward or past 25, now you've got both direction and strength aligned. That's when the probability shifts in your favor. Think of the DI lines as pointing the way, while the ADX tells you whether it's worth following that direction. Neither tells the full story alone, but together they give you context that actually matters.
Practical Trading Applications


Understanding how the ADX works is one thing. Actually using it to make better trading decisions is another. The good news is that once you know what you're looking at, the ADX becomes one of the more straightforward tools in your arsenal. Let's talk about how to put it to work.
Identifying When Trends Are Worth Trading
Not every price move deserves your attention or your capital. The ADX helps you separate the signal from the noise so you can focus your energy where it counts.
-
Wait for ADX above 25 before committing to trend trades: Below this level, you're gambling on whether a trend will develop. Above it, you're trading a trend that already exists.
-
Avoid trend-following strategies when ADX is below 20: These are range-bound conditions. Breakouts often fail, and momentum strategies get chopped up. Save your trend tactics for when the market is actually trending.
-
Look for rising ADX as confirmation: A breakout with ADX climbing from 15 to 30 has legs. A breakout with ADX stuck at 18 probably doesn't.
-
Be selective above ADX 50: Yes, the trend is strong, but you might be late. Consider whether the risk-reward still makes sense, or if waiting for a pullback is smarter.
Spotting Potential Trend Reversals
The ADX indicator won't predict reversals, but it can show you when a trend is running out of gas. When ADX peaks and starts declining after spending time above 40 or 50, the existing trend is losing participants. The conviction that drove the move is fading. This doesn't automatically mean a reversal is coming—sometimes the market just transitions into a range. But it does mean the easy money phase of the trend is probably over. Watch for the DI lines to converge and potentially cross during these periods. If -DI crosses above +DI while ADX is falling from high levels, that's your clue that sellers might be taking over from exhausted buyers.
Pro tip: Combine a falling ADX with price action at key support or resistance levels. If ADX is dropping and price is testing a major level, you've got both weakening momentum and a potential turning point. That's when reversals become more probable.
Combining ADX With Other Indicators
The ADX plays well with others. It adds a layer of confirmation that makes other tools more reliable.
-
Moving averages + ADX: Use moving average crossovers for direction, but only take the trade if ADX is above 25 and rising. This filters out the false signals that plague moving averages in choppy markets.
-
Support and resistance + ADX: A breakout above resistance means more when ADX confirms there's real momentum behind it. Breakouts with ADX below 20 often lead to head fakes.
-
RSI or MACD + ADX: These oscillators show overbought/oversold conditions or momentum shifts. Add ADX to distinguish which signals are happening within a strong trend (worth respecting) versus which are just noise in a weak trend (safe to fade).
-
Volume indicators + ADX: Rising ADX with increasing volume validates that institutions are participating. Rising ADX with weak volume suggests the move might be fragile.
Different Timeframe Considerations
The standard 14-period setting works across timeframes, but how you interpret ADX readings changes based on your trading style and chart period.
-
Day trading (1-15 minute charts): Trends develop and fade faster. ADX above 20 might be enough to trade on. Don't wait for readings above 40—by then the intraday move could already be done.
-
Swing trading (hourly to daily charts): This is where the standard ADX thresholds (25 for trend confirmation, 50 for strong trends) work best. You've got time to let trends develop and you want clear confirmation before committing.
-
Position trading (daily to weekly charts): Look for sustained ADX readings above 30. These longer timeframes filter out noise naturally, so when ADX stays elevated for weeks, you're riding institutional-grade trends.
The ADX indicator adapts to whatever timeframe you trade, but faster timeframes require faster decisions and lower threshold expectations.
Common Mistakes and Limitations


No indicator is perfect, and the ADX is no exception. Even experienced traders fall into the same traps when they forget what this tool was designed to do—and what it wasn't. Knowing where the ADX falls short will save you from some painful lessons.
-
Trading direction based on ADX alone: This is the big one. You see ADX at 35 and think "strong trend, time to buy!" But you didn't check if it's an uptrend or downtrend. The ADX doesn't care which way price is moving, so neither should you trade it without also checking the +DI/-DI lines or the actual price chart. Buying into a strong downtrend because ADX is high is a fast way to lose money.
-
Ignoring the lag factor: The ADX is a lagging indicator by design. It smooths data over 14 periods (or whatever setting you use), which means it's always looking backward. By the time ADX confirms a strong trend is underway, that trend has already been moving for a while. You'll rarely catch the very beginning of a trend using ADX alone. This isn't a flaw—it's a feature that filters out noise—but it does mean you trade confirmation over anticipation.
-
Overreliance in choppy markets: When ADX stays below 20 for extended periods, it's telling you the market is range-bound. Some traders see this and keep trying to find trends anyway, forcing trades that aren't there. Others get frustrated that the indicator "isn't working." It's working fine—it's telling you not to use trend-following strategies right now. Listen to it.
-
False signals during consolidation breakouts: Here's a tricky one. Price breaks out of a tight consolidation, ADX starts rising from low levels, and you jump in expecting a big trend. Sometimes you get it. Other times, price makes a brief move and then collapses back into the range. The ADX indicator can't tell the difference between a breakout that will run and one that will fail. It just measures the initial momentum burst. This is why you need confirmation from other tools—price structure, volume, key levels—before trusting a breakout just because ADX is rising.
The Reality Check
The ADX indicator is excellent at what it does: measuring trend strength after that trend is already in motion. It keeps you out of weak markets and confirms when strong markets are worth your attention. But it won't catch tops or bottoms, it won't predict the future, and it won't tell you which direction to trade without help from other tools. Use it as part of a broader approach, not as a standalone trading system. Respect its limitations and it'll help you avoid the kinds of markets where most traders get chopped to pieces.
Settings and Customization


When Wilder created the ADX, he chose a 14-period lookback for a reason. It wasn't arbitrary—it balanced responsiveness with reliability. Most charting platforms default to this setting, and for most traders, that's exactly where it should stay. But trading isn't one-size-fits-all, and sometimes adjusting the period makes sense for your specific approach.
-
The 14-period standard captures roughly two weeks of daily data: This timeframe smooths out daily noise while still responding to meaningful shifts in momentum. It's long enough to avoid reacting to every minor wiggle in price, but short enough to catch developing trends before they're over.
-
It works across multiple timeframes: Whether you're looking at 5-minute bars or weekly charts, 14 periods provides a consistent framework for measuring trend strength relative to recent price action.
-
Most trading literature and education uses 14-period ADX: Sticking with the standard makes it easier to compare what you're seeing with what other traders discuss and what you read in books or articles.
-
The threshold levels (20, 25, 50) were calibrated to this setting: If you change the period, these common benchmarks might not apply the same way anymore.
Adjusting for Different Trading Styles
The right ADX setting depends on how long you hold trades and how much noise you're willing to tolerate. Shorter periods make the ADX indicator more sensitive but jumpier. Longer periods make it smoother but slower to react.
-
Scalping and day trading (1-10 minute charts): Consider dropping to 7-10 periods. You need faster signals because intraday trends develop and fade quickly. A 14-period ADX on a 5-minute chart might not react fast enough for entries and exits that matter in minutes, not hours.
-
Swing trading (hourly to daily charts): Stick with 14 periods. This is the sweet spot for trades lasting days to weeks. You get reliable trend confirmation without premature signals that lead to whipsaws.
-
Position trading (daily to weekly charts): Try extending to 20-28 periods if you want to filter out even more short-term volatility. Longer-term traders benefit from a smoother ADX that only responds to sustained directional movement.
When to Modify and When to Stick With Defaults
Changing settings should be intentional, not random. Here's a practical guide for when adjustments make sense and when they're just tinkering for the sake of it.
IF you're new to using ADX, THEN keep the 14-period default until you understand how it behaves across different market conditions. Learn the tool properly before you start customizing it.
IF you're getting too many false signals on short timeframes, THEN try increasing the period to 18-21. This adds smoothing and reduces whipsaws, though you'll sacrifice some early entry opportunities.
IF you're missing trend starts because ADX responds too slowly, THEN try decreasing the period to 10-12. This makes it more reactive, but be ready for more noise and false starts.
IF you trade the same asset every day, THEN backtest different ADX settings on that specific market. Some assets trend more cleanly than others, and you might find that 11 or 16 periods works better for your particular setup.
IF you're tempted to optimize settings to fit past data perfectly, THEN stop. Over-optimization leads to settings that worked great historically but fail going forward. The goal isn't perfection—it's reliability across various market conditions.
The best ADX setting is the one you understand deeply and can trust when real money is on the line.
Putting the ADX Indicator to Work

The ADX isn't going to revolutionize your trading overnight. No single indicator will. But what it does offer is something genuinely useful: a clear, objective measure of whether the market is trending or just wandering around aimlessly. In a field full of tools that promise the moon and deliver confusion, that kind of straightforward feedback is rare and worth paying attention to.
Think of the ADX as one member of your analytical team. It answers specific questions about trend strength, but it needs help from price action, volume, support and resistance, and whatever other tools fit your trading style. The traders who get the most out of the ADX indicator are the ones who understand its role—not as a magic solution, but as a reliable filter that keeps them focused on the right market conditions.
Building Your ADX Intuition
Reading about how ADX works is step one. Actually developing a feel for it takes time and screen time. Pull up charts of different assets across different timeframes. Watch how ADX behaves during strong trends, weak trends, and sideways chop. Notice how the +DI and -DI lines dance around each other during range-bound periods versus how they separate during directional moves. Pay attention to what happens when ADX peaks above 50 and starts declining. This kind of observation builds pattern recognition that no article can fully teach you.
Start simple. Use the standard 14-period setting. Wait for ADX above 25 before considering trend trades. Check the DI lines for direction. That's enough to improve your trade selection right there. As you get comfortable, you can layer in more nuance—combining ADX with your other tools, adjusting timeframes, recognizing when high readings signal opportunity versus exhaustion. But the foundation stays the same: the ADX tells you if there's a trend worth trading, and you handle the rest.
The beauty of this indicator is that it doesn't try to do everything. It measures one thing well, and that focused simplicity is exactly what makes it effective.
