


Skewed Left vs Skewed Right: What Your Charts Are Really Telling You


Most traders stare at the same charts and see completely different things. You're looking at price bars, candlesticks, maybe some indicators. But here's the thing—while you're focused on whether the next candle closes green or red, you're missing the larger story that price is writing right in front of you. The market isn't just moving up or down. It's clustering, distributing, and leaving clues about where the real interest lies.
The Pattern Hiding in Plain Sight
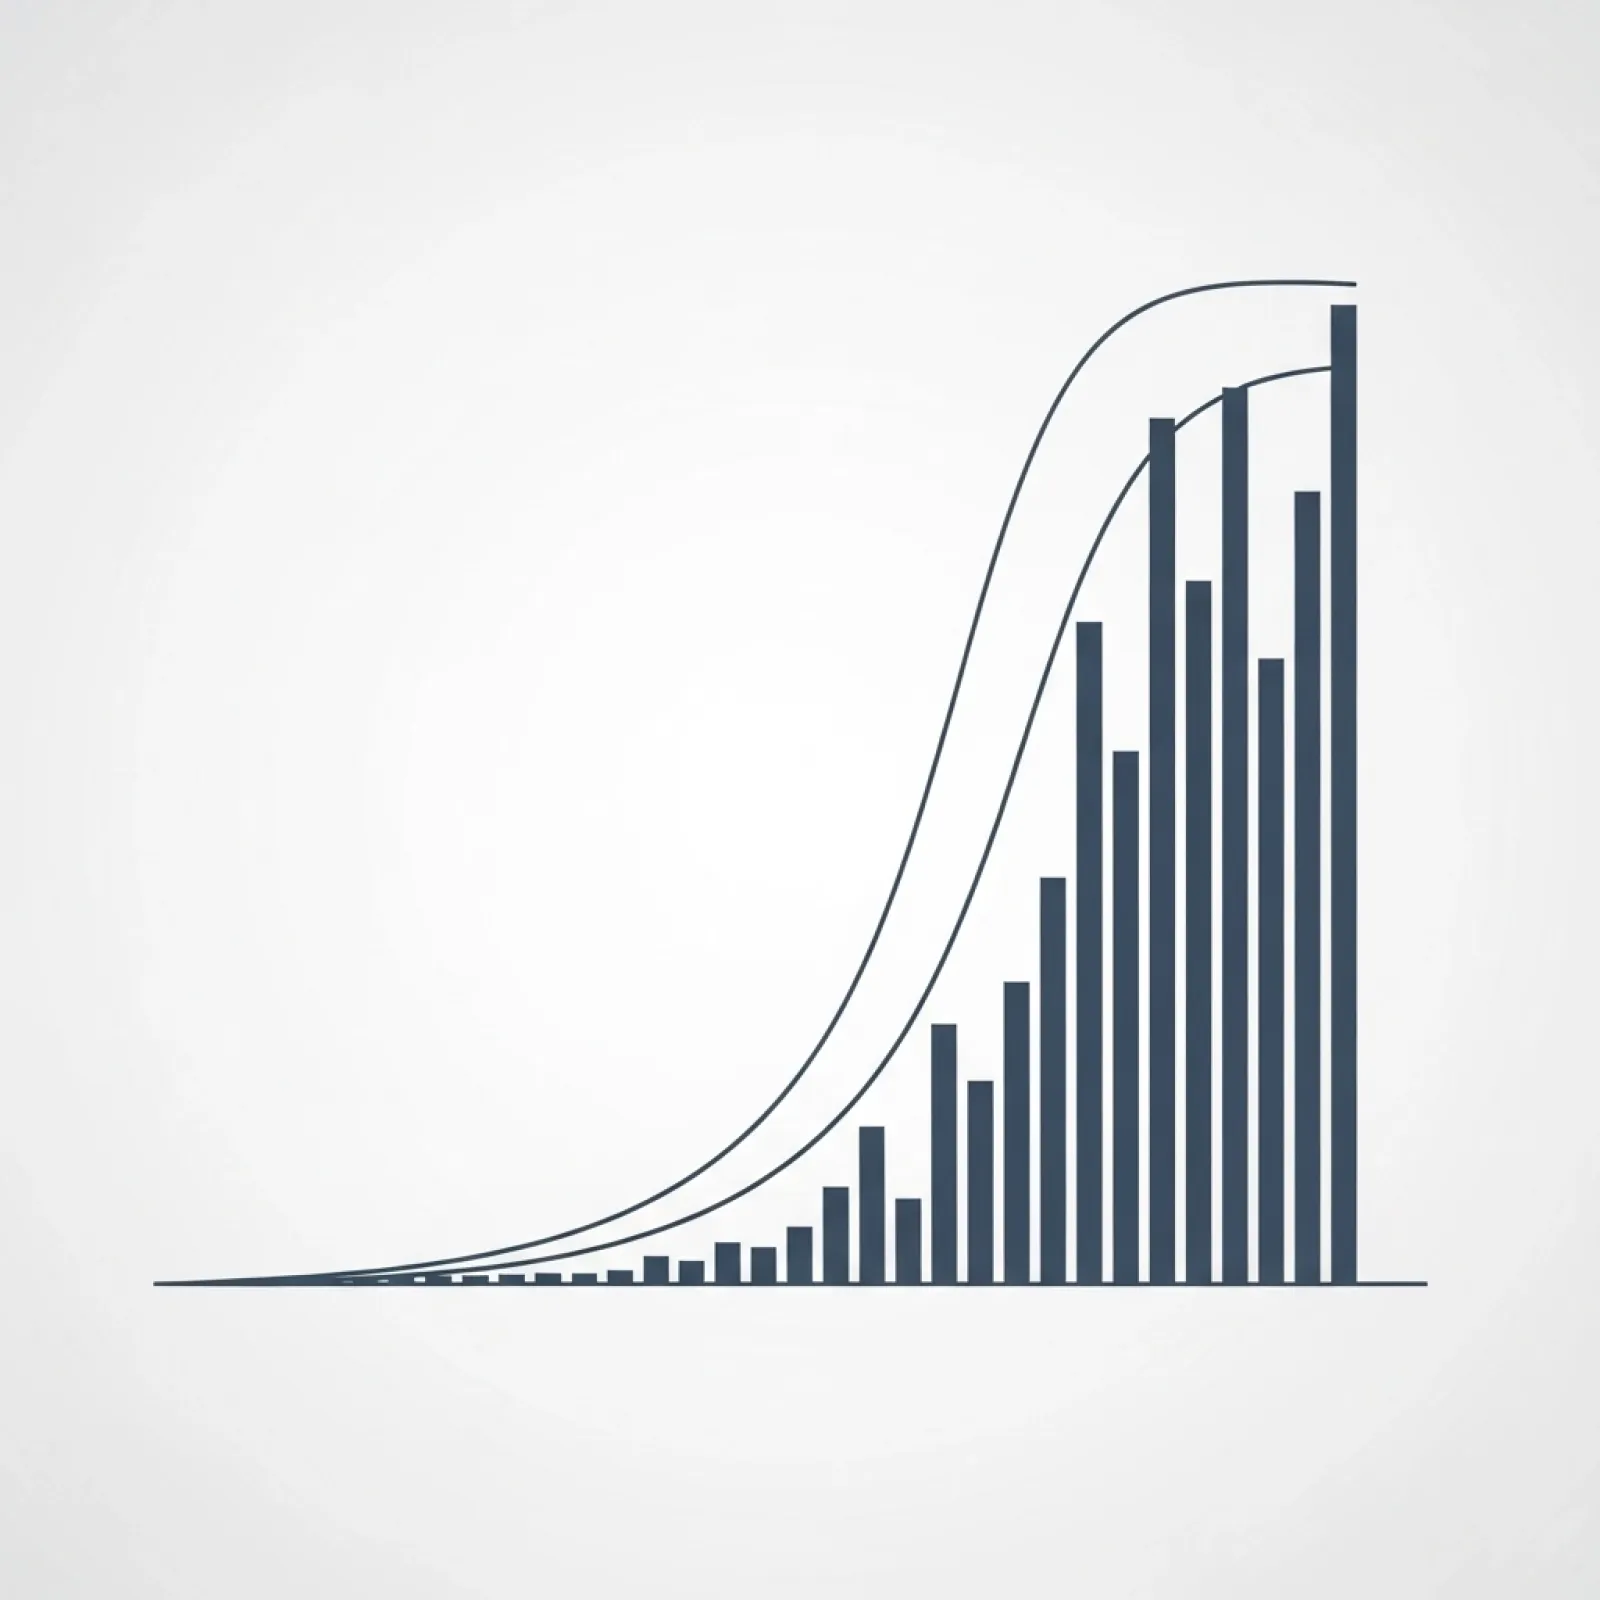
Price action creates shapes. Not the obvious triangles and flags you've been taught to spot, but something more subtle: the way price organizes itself around certain levels over time. Some traders call this distribution. Others talk about value areas. But what matters is this: when you zoom out slightly and look at how price has been behaving, you start to see asymmetry. The moves aren't balanced. They lean. They favor one side.
-
Price tends to spend more time at certain levels than others
-
The way these clusters form tells you where buyers and sellers are actually making decisions
-
When you see price skewing left or right, you're seeing the market's center of gravity shift
-
This isn't about predicting the future—it's about reading what's already happened more clearly
What You'll Learn Here
This isn't another article about support and resistance or trend lines. We're going to look at how skewed left vs skewed right distributions reveal where the market considers price "fair" versus where it's getting rejected. You'll learn to spot these patterns on your own charts, understand what they mean about buyer and seller dynamics, and use that information to time your entries better.
-
How to identify left-skewed and right-skewed price distributions
-
What each pattern tells you about market sentiment and positioning
-
Practical entry strategies based on distribution patterns
-
Real examples of how this plays out across different timeframes
-
Common mistakes that turn good analysis into bad trades
Understanding skewed left vs skewed right distributions won't make you a fortune overnight, but it will change how you read price—and that's worth more than any single trade.
The Basics: What Distribution Actually Means


Think about a busy coffee shop. People don't spread out evenly across all the tables. They cluster near the windows, avoid the bathroom hallway, and pack around the outlets. Price does the same thing. It doesn't move through levels with equal interest—it lingers where buyers and sellers agree, and rushes through areas where they don't. When you start seeing your charts as a record of where price actually spent its time, not just where it opened and closed, you begin trading differently.
Price Leaves a Trail
Every chart you look at is a history of acceptance and rejection. When price hangs around a level for multiple candles, testing it repeatedly, that's acceptance. When it blows through a zone without looking back, that's rejection. The shape this creates over time—how price clusters and spreads—is what we mean by distribution. You're not looking at individual candles anymore. You're looking at the footprint of market activity.
-
Price clusters reveal where the majority of trading actually happened
-
The "middle" of a range isn't necessarily the center point between high and low
-
Distribution shows you where buyers and sellers found equilibrium, even temporarily
-
Volume adds weight to price levels—more volume means more commitment at that price
-
Time matters too: price spending hours at one level tells a different story than a quick spike
Reading the Asymmetry
Here's where skewed left vs skewed right comes in. If you look at a day's worth of price action and notice that most of the candles clustered near the high, with just a few quick dips lower, you're seeing a left-skewed distribution. The bulk of the action happened up top. The opposite holds true when price spends most of its time near the lows with occasional pops higher—that's right-skewed. This asymmetry isn't noise. It's information. It tells you where the market felt comfortable and where it didn't. The middle isn't always in the middle because buyers and sellers aren't always balanced. When you can spot which side carries more weight, you stop fighting the current and start swimming with it.
Left-Skewed Distribution: When Price Favors the Upside

Picture a rubber band stretched down and then released. Price drops quickly, but then spends the rest of its time bouncing around near the highs. That's a left-skewed distribution. The tail stretches to the left (the lows), but the meat of the action—the real business—happens on the right side, up near the recent highs. When you see this pattern, you're watching buyers defend a level and reject lower prices. They're saying "not here, not lower" with their wallets.
What You're Actually Seeing
A left-skewed pattern shows up when price makes a sharp move lower but quickly recovers and then consolidates near the upper end of that range. The histogram of where price spent its time would show a thin tail pointing left toward those lows, with a thick cluster of activity stacked on the right. This isn't just a bounce—it's sustained interest at higher prices. The market tested lower levels, found nothing there worth staying for, and moved back up where buyers were willing to do business.
-
Price makes a relatively quick move to establish the low of the range
-
The recovery happens faster than the decline, often with strong momentum
-
Most subsequent candles cluster near the top of the range
-
Dips get bought quickly, with price returning to the upper zone
-
Volume often shows strength on the moves higher, weakness on the dips
The Psychology: Buyers Stepping In Hard
When you see a left-skewed distribution forming, you're watching a specific dynamic play out. Sellers tried to push price lower—maybe on news, maybe just profit-taking—but buyers weren't having it. They stepped in, absorbed the selling, and pushed price back up. Then they stuck around. Each time price dipped back toward that initial low, buyers returned. This creates the skew. Sellers got their shot at the left side of the distribution and couldn't maintain control. Buyers took over and held the right side.
-
Buyers see the dip as opportunity, not danger
-
The initial low becomes a reference point where demand overwhelms supply
-
Each test of lower prices brings in more buying interest
-
Sellers who try to push lower get absorbed quickly
-
The market establishes a "floor" that's actively defended
Common Setups Where This Shows Up
You'll spot left-skewed distributions after failed breakdowns, during bull flag consolidations, and in the early stages of trend reversals. Any time the market tries to go lower but can't sustain it, watch how price reorganizes itself. If it camps out near the highs while occasionally testing lower, that's your signal. This pattern appears across all timeframes—you might see it develop over a few hours on an intraday chart or over several days on a daily chart.
-
Failed breakdown attempts where price quickly recovers
-
Bull flags and tight consolidations leaning toward the top
-
Reversal patterns after a downtrend, especially when volume confirms
-
Pullbacks within uptrends that refuse to follow through lower
-
Range-bound markets where price consistently rejects the lower half
Pro tip: When comparing skewed left vs skewed right patterns, left-skewed setups give you a clear risk level (that defended low) and show you where the market doesn't want to be. Your entries work best when you align with the buyers who keep pushing price back to the right side of the distribution. Wait for price to test that low one more time, watch for the rejection, and join the move back toward where the action lives.
Right-Skewed Distribution: When Price Favors the Downside

Now flip the script. Price pops higher—maybe on a gap, maybe on some temporary enthusiasm—but then spends the bulk of its time grinding lower and consolidating near the lows. That's a right-skewed distribution. The tail extends to the right (the highs), while the actual trading activity clusters on the left side, down near the recent lows. When you spot this, you're watching sellers control the narrative. Every attempt to bounce gets met with fresh selling pressure, and the market keeps gravitating back toward where sellers are most comfortable: lower.
What Defines This Pattern
A right-skewed pattern emerges when price spikes higher but can't maintain those levels, then proceeds to spend most of its time trading near the bottom of the established range. If you stacked up where all the candles lived, you'd see a thin tail reaching right toward those highs, with a dense pile of activity clustered on the left. This isn't just weakness—it's persistent rejection of higher prices. The market tried the upside, didn't like what it found there, and settled back down where sellers were actively working.
-
Price establishes the high of the range with a relatively quick move
-
The decline happens with more conviction than the initial rise
-
Most candles cluster near the lower end of the range
-
Rallies get sold into consistently, with price returning to the lower zone
-
Volume often increases on down moves, dries up on attempts to rally
-
Each bounce gets smaller and weaker than the last
The Psychology: Sellers Dominating Price Zones
Right-skewed distributions tell you that sellers are in control and they're not backing down. Buyers might have pushed price higher initially—maybe they got excited, maybe they saw a headline—but sellers were waiting. Once price reached those elevated levels, selling pressure came in waves. Every time buyers tried to reclaim the high ground, sellers stepped in and pushed them back down. This creates the skew. Buyers got their moment on the right side of the distribution, but couldn't hold it. Sellers own the left side and defend it relentlessly.
-
Sellers view rallies as opportunities to get out or add shorts, not as signs of strength
-
The initial high becomes a ceiling where supply overwhelms demand
-
Each attempt to push higher brings in more selling interest
-
Buyers who try to sustain rallies get overpowered quickly
-
The market establishes a "ceiling" that's actively defended
-
Trapped longs from the high start looking for exits, adding to selling pressure
Common Setups and Warning Signs
You'll find right-skewed distributions after failed breakouts, during bear flag formations, and in distribution phases where smart money is quietly exiting. Watch for these patterns when uptrends start showing cracks or when price pushes to new highs but can't attract follow-through. The pattern appears across all timeframes—you might see it build over a trading session or develop across multiple weeks on a daily chart. Pay attention when price keeps testing lower while leaving that high untouched.
-
Failed breakout attempts where price quickly reverses and stays weak
-
Bear flags and consolidations that lean toward the bottom
-
Distribution patterns at the end of uptrends, especially with declining volume on rallies
-
Bounces within downtrends that can't maintain momentum
-
Range-bound markets where price consistently rejects the upper half
-
Gaps up that get filled and never recovered
-
Multiple lower highs forming while price camps near support
DO: Recognize that skewed left vs skewed right patterns show opposite market dynamics—right-skewed tells you the market rejected higher prices and sellers are in control. Use the established high as a clear resistance level and watch for continuation lower.
DON'T: Fight right-skewed distributions by trying to catch a bounce. Those rallies back toward the right side of the distribution get sold, repeatedly. The pattern is showing you where the market doesn't want to be—don't stand in front of that message hoping for a reversal that isn't coming yet.
Practical Application: Using Skew to Time Your Entries


Knowing what a distribution pattern looks like is one thing. Using it to actually enter trades is another. The beauty of understanding skew is that it hands you a roadmap for where to look for entries and where to place your stops. You're no longer guessing at support and resistance—you're reading where the market has already shown you it wants to trade. Fair value isn't some theoretical midpoint. It's where the bulk of the activity happened, where buyers and sellers actually agreed to do business. When you can identify that zone and see which direction the skew is leaning, your entries become less about hope and more about probability.
Where Fair Value Actually Lives
Fair value sits where the market spent most of its time—not at the arithmetic center of the range, but where volume and price action clustered. In a left-skewed distribution, fair value is up near the highs because that's where the trading happened. In a right-skewed distribution, it's down near the lows. This matters because when price moves away from fair value, there's a natural tendency for it to get pulled back. That's your opportunity. You want to enter when price strays from the skewed side of the distribution and starts returning to where the real interest lies.
-
The point of control (where most volume traded) usually sits near the thick part of the distribution
-
Fair value isn't static—it shifts as new price action develops
-
When price moves away from the cluster, it's moving away from acceptance
-
The further price strays from fair value, the stronger the potential snap back
-
Understanding where fair value sits helps you identify when price is "cheap" or "expensive" relative to current market sentiment
Entry Strategies for Left-Skewed Patterns
When you've identified a left-skewed distribution, you're looking for entries that align with buyers who keep defending the left tail. Your best setups come when price dips back toward that defended low—the left edge of the distribution—and shows signs of rejection. You're not catching a falling knife. You're waiting for the market to test the level where buyers have repeatedly shown up, then joining them when they do it again.
-
Wait for price to pull back toward the left tail (the low of the distribution)
-
Look for bullish price action signals: strong closes, rejection wicks, volume pickup
-
Enter on the bounce back toward fair value (the right side where price has been clustering)
-
Your stop goes just below the left tail—if buyers don't defend it this time, the pattern is broken
-
Target the right edge of the distribution first, then look for extension if momentum continues
-
Best entries come when price tests the defended low on declining volume, then reverses with increasing volume
Entry Strategies for Right-Skewed Patterns
Right-skewed distributions set you up for entries that align with sellers who keep rejecting higher prices. You want to enter when price rallies back toward that right tail—the high that couldn't hold—and shows signs of rejection. You're not shorting into strength. You're waiting for price to test the ceiling where sellers have repeatedly stepped in, then joining them when they push it back down.
-
Wait for price to rally toward the right tail (the high of the distribution)
-
Look for bearish price action signals: weak closes, rejection wicks, sellers stepping in
-
Enter on the move back toward fair value (the left side where price has been clustering)
-
Your stop goes just above the right tail—if sellers don't defend it this time, the pattern is invalidated
-
Target the left edge of the distribution first, then watch for continuation if selling pressure persists
-
Best entries come when price tests the rejected high on decreasing volume, then reverses with increasing selling volume
Stop Placement Based on Distribution Edges
Your stops should sit just beyond the edges of the distribution because that's where the pattern breaks. In a left-skewed setup, if price drops below the defended low, buyers aren't showing up anymore—get out. In a right-skewed setup, if price breaks above the rejected high, sellers have lost control—get out. The edges of the distribution aren't arbitrary levels. They're where the market has drawn clear lines about what it will and won't accept.
-
Stops go just beyond the tail of the distribution (left tail for bullish setups, right tail for bearish setups)
-
Give yourself enough room to avoid normal noise—use the structure of the pattern, not arbitrary percentages
-
If the pattern is forming over multiple days, your stop should account for daily volatility
-
A break of the distribution edge with volume is your signal the setup has failed
-
Don't move your stop closer once the trade is on—the edge is the edge
Quick tip: The tighter the distribution (the more compressed the price action), the cleaner your risk-reward setup. Wide, sloppy distributions with multiple tails give you less clarity about where stops should go and where fair value actually sits.
Volume Tells You If It's Real
Volume confirms whether what you're seeing in the distribution is backed by conviction or just noise. In skewed left vs skewed right patterns, you want to see volume supporting the skew. For left-skewed setups, volume should be heavier on moves toward the right (upward) and lighter on dips to the left. For right-skewed setups, volume should increase on moves toward the left (downward) and decrease on rallies to the right. If volume contradicts the pattern—heavy volume on the wrong moves—the distribution is lying to you.
IF you see a left-skewed distribution forming with volume increasing on every test of the low and decreasing at the highs, THEN be cautious—buyers might not be as committed as the pattern suggests.
IF you spot a right-skewed distribution but volume dries up on the moves lower, THEN sellers might be losing steam and the pattern could reverse.
IF price tests the edge of the distribution (left or right tail) and volume spikes with a strong rejection, THEN that's your confirmation to enter in the direction of the skew.
IF price breaks through the tail with conviction and follow-through volume, THEN the distribution pattern has failed and you need to reassess or exit.
Common Mistakes and Misconceptions


You're going to mess this up at first. Everyone does. The most common trap is seeing what you want to see instead of what's actually there. You'll spot a left-skewed distribution and think "bullish setup" without checking whether the broader trend is falling apart. Or you'll find a perfect right-skewed pattern on a 5-minute chart while the daily chart is screaming the opposite message. Distribution analysis is powerful, but only when you use it honestly and in context. Let's talk about where traders typically go wrong.
The Mistake Everyone Makes
Here's the thing: a left-skewed distribution doesn't automatically mean "buy" any more than seeing green candles means the trend is up. And a right-skewed distribution isn't a standalone short signal. These patterns show you where price has been accepted and rejected within a specific timeframe and context. They don't predict the future. They describe the present battle between buyers and sellers. When you confuse description with prediction, you start forcing trades that aren't really there.
-
Confusing skew with trend direction: Just because price is left-skewed doesn't mean the overall trend is bullish. You might be looking at a left-skewed consolidation within a larger downtrend—that's a bear flag, not a buy signal. The skew tells you about the current distribution, not the bigger picture direction.
-
Ignoring timeframe context: A left-skewed pattern on the 15-minute chart means nothing if the daily chart shows a right-skewed distribution with sellers in control. Always check what the higher timeframe is doing. Your intraday skew might just be noise within a larger pattern moving the other direction.
-
Trading the pattern without price action confirmation: You see the distribution forming and jump in before price actually tests the edge and shows rejection. The pattern sets up the opportunity, but you still need price action to confirm the trade. Enter too early and you're just guessing.
-
Forgetting about volume: A distribution pattern without volume confirmation is just shapes on a chart. If the skew suggests buyers are in control but volume is declining on up moves, you're reading a story that isn't real. Volume validates or invalidates what the distribution appears to be showing you.
-
Looking for perfect patterns: Real markets are messy. You won't always see textbook skewed left vs skewed right distributions. Sometimes the skew is subtle. Sometimes it's mixed. If you're waiting for the perfect setup, you'll miss tradeable ones and probably force trades on patterns that aren't actually there.
-
Assuming the pattern will continue: Distributions describe what has happened, not what will happen. A left-skewed pattern can turn right-skewed quickly if sentiment shifts. Don't marry your analysis. When the distribution changes, your bias should change with it.
-
Using distribution as your only tool: Distribution analysis works best as one input among several. If you're making decisions based solely on skew without considering support/resistance, trend structure, or market context, you're trading with one eye closed.
When Distribution Analysis Doesn't Matter
Sometimes the distribution doesn't matter at all. During extreme volatility—earnings reports, major news events, market crashes—price isn't distributing in any meaningful pattern. It's just reacting. In these moments, distribution analysis will mislead you because the normal dynamics of acceptance and rejection get thrown out the window. Everyone's panicking or rushing in, and the usual footprints don't form. When you see wild, erratic price action with gaps and massive volume spikes, put the distribution analysis aside. Watch the actual price action instead: where are the obvious support and resistance levels getting tested? What's the volume doing at key levels? Is there any structure forming at all, or is it just chaos?
Strong trends also diminish the value of distribution analysis—when price is running hard in one direction with consistent momentum, you don't need to analyze where it's clustering. It's not clustering. It's trending. In those situations, focus on trend-following techniques, momentum indicators, and riding the move rather than trying to find subtle distribution patterns that aren't forming. Know when your tool works and when to reach for a different one.
Putting It Together: A Step-by-Step Approach


Theory is worthless if you can't apply it when you're staring at a live chart with real money on the line. So let's walk through exactly how to use distribution analysis from start to finish.
This isn't about memorizing rules—it's about developing a process you can repeat. The goal is to train your eye to see these patterns naturally, then verify what you're seeing before risking anything. Here's how you actually do this.
Step One: Identifying the Distribution Pattern
Start by zooming out slightly on your chart. You're not looking at individual candles anymore—you're looking at the shape they create together.
Ask yourself: where has price spent most of its time? Look for the cluster. Is it near the top of the recent range or near the bottom?
Now look at the tails. Is there a long wick or series of candles that reached lower but didn't stick? That's a left-skewed pattern forming. Is there a spike higher that got rejected with price settling back down? That's right-skewed.
Draw a simple box around the range if it helps. Mark the high, the low, and where the bulk of the candles are stacking up. The skew becomes obvious once you stop focusing on every single price movement and start seeing the overall shape.
Pro tip: Use a different timeframe to confirm the pattern. If you're trading off a 1-hour chart, check the 4-hour or daily to see if the distribution pattern you're seeing aligns with or contradicts the bigger picture. A left-skewed pattern on the hourly that sits inside a right-skewed pattern on the daily is telling you something different than if both timeframes agree.
Pro tip: Volume profile tools can help, but you don't need them. Just eyeball where the candles are dense versus sparse. If most candles are packed toward the top with just a few quick visits to the bottom, you've got your left skew. If they're piled at the bottom with occasional pokes higher, that's your right skew.
Step Two: Confirming the Bias with Volume and Price Action
Once you think you've identified a skewed left vs skewed right pattern, don't jump in yet. You need confirmation.
Look at volume: is it supporting what the distribution suggests?
-
In a left-skewed pattern, you want to see volume increasing on moves toward the right (higher) and decreasing on dips to the left (lower). That tells you buyers are showing up with conviction where it matters.
-
In a right-skewed pattern, volume should be heavier on moves down and lighter on rallies.
If volume contradicts the pattern, slow down.
Next, watch how price behaves at the edges. When price tests the tail of the distribution, does it get rejected quickly? Do you see long wicks and fast reversals, or does price slowly grind through the level?
Strong rejection at the tail with volume backing it up is your green light. Weak, choppy price action at the tail means the pattern isn't mature yet or might not hold.
Step Three: Setting Up the Entry
Now you're ready to plan the trade.
For a left-skewed pattern: You want to enter when price pulls back toward the left tail (the defended low) and shows rejection. Set an alert or watch for price to approach that level. When you see bullish price action—a strong bounce, a rejection wick, volume stepping in—that's your entry signal. Your stop goes just below the tail. If buyers don't defend it this time, you're wrong and need to get out.
For a right-skewed pattern: Wait for price to rally back toward the right tail (the rejected high). When you see bearish rejection—sellers stepping in, weak closes, volume confirming—enter short. Stop goes just above the tail.
Your first target should be a move back toward the thick part of the distribution (fair value), then reassess if the move continues.
Quick tip: Don't set your stop exactly at the tail. Give it a little breathing room based on the average candle size or recent volatility. You want to avoid getting stopped out by noise, but not so much room that your risk balloons.
Quick tip: Calculate your position size based on the distance to your stop, not on how confident you feel. The edge of the distribution defines your risk. If that distance is too large for your account size, skip the trade. There will be another one.
Managing the Trade Once You're In
After you enter, your job shifts from analysis to management. Watch how price behaves as it moves toward your target. Is volume supporting the move? Are other traders joining in, or are you alone?
If price stalls halfway back to fair value and starts forming the opposite distribution pattern, that's your cue to tighten your stop or take profits. Don't fall in love with your initial analysis.
Markets change, distributions shift, and being right about the setup doesn't mean you'll be right about the follow-through. The pattern got you in—let changing conditions get you out.
Trail your stop as the trade moves in your favor, and be willing to exit if the distribution pattern that gave you the trade starts breaking down.
The best traders don't just identify patterns—they adapt when those patterns evolve. Distribution analysis gives you a framework for understanding where the market has been and where it's currently accepted. But the market doesn't care about your framework. Stay flexible, trust your stops, and remember that even the cleanest distribution setup can fail. That's why you use proper risk management. One trade won't make or break you, but a process you can repeat over hundreds of trades will.
Making Skewed Left vs Skewed Right Work for You


Distribution analysis isn't going to revolutionize your trading overnight. It's not a magic indicator or a secret formula that guarantees wins. What it does offer is a lens—a way of reading price that goes deeper than "it's going up" or "it's going down." When you understand how price distributes itself, where it clusters, and what that clustering means about buyer and seller dynamics, you stop reacting to every candle and start reading the story the market is actually telling. This is one tool. A good one. But still just one tool in a larger process that includes risk management, trend analysis, market context, and honest self-assessment.
Building the Pattern Recognition Muscle
The first few times you look for skewed left vs skewed right distributions, it'll feel clunky. You'll second-guess what you're seeing. You'll wonder if the cluster is really where you think it is or if you're just seeing what you want to see. That's normal. Pattern recognition is a skill that builds slowly, through repetition and feedback. The more charts you analyze, the faster your brain will start identifying these distributions without conscious effort. One day you'll glance at a chart and immediately see the skew without having to think about it.
-
Start by reviewing charts after the market closes—no pressure, just observation
-
Mark up past price action and identify where distributions formed and how they resolved
-
Keep a journal of setups you find, noting what you saw and how the trade would have played out
-
Compare your analysis across different timeframes to see how patterns nest within each other
-
Review your mistakes honestly—when you thought you saw a pattern but got it wrong, figure out why
-
Don't rush this process—give yourself weeks, not days, to get comfortable spotting these setups
Practice Without the Pressure
The best way to get better at this is to do it when money isn't on the line. Pull up charts from stocks, futures, forex—whatever you trade—and scroll back in time. Identify a range of price action and ask yourself: where did price cluster? Which direction is the skew? What would the entry have been, where would the stop go, and how did it actually play out? Do this for dozens of examples.
You'll start seeing patterns repeat. You'll notice that certain market conditions produce cleaner distributions than others. You'll learn which timeframes give you the most tradeable setups for your style. Then, when you're ready, start watching for these patterns in real-time but don't trade them yet. Just call them out to yourself or in a trading journal. Only after you've built confidence in your ability to identify and interpret these distributions should you start putting money behind them.
Remember: Distribution analysis works because it reflects real market behavior—buyers and sellers clustering around prices they find acceptable and rejecting prices they don't. The patterns aren't magic. They're footprints. Learning to read those footprints takes time, but once you can, you'll never look at a chart the same way again. Start small, practice consistently, and trust that your eye will sharpen with each chart you study.
