

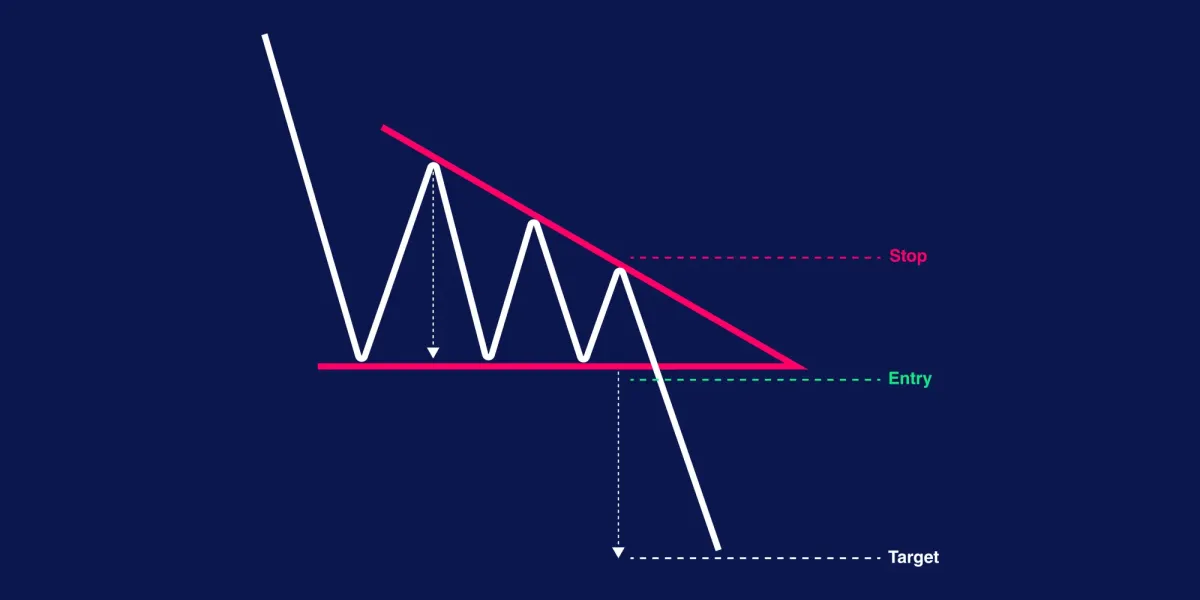

Understanding the Descending Triangle Pattern
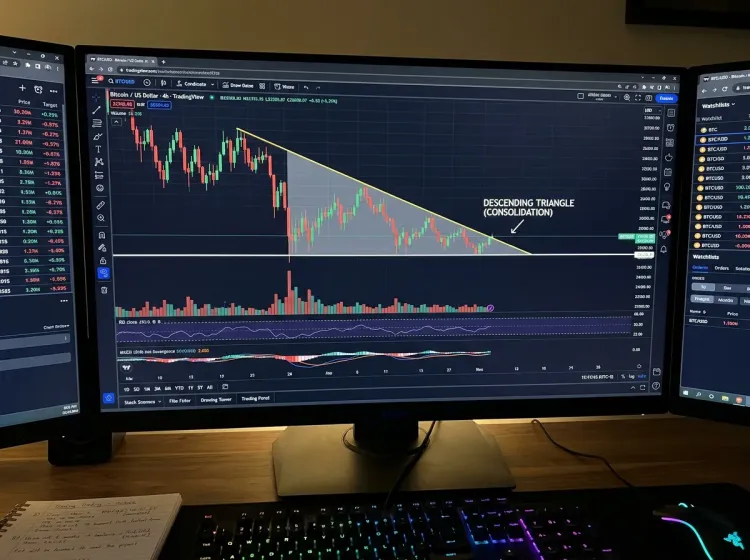
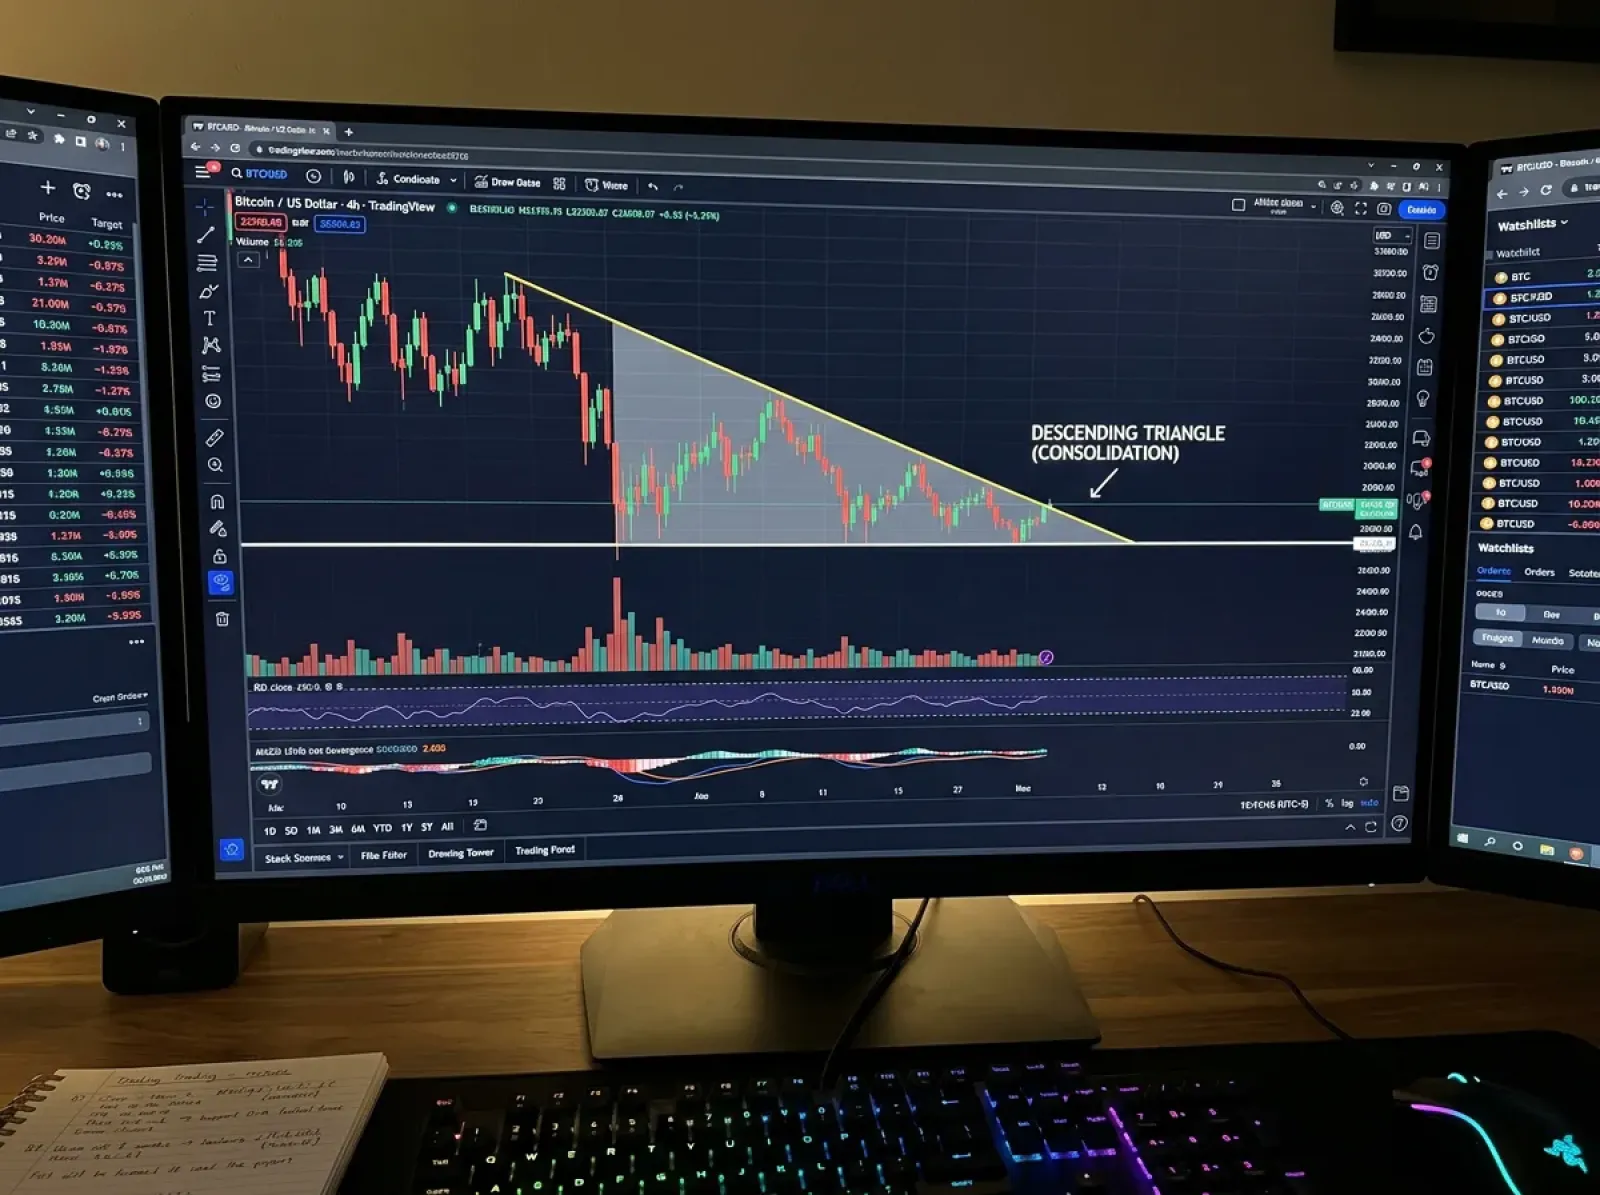
The descending triangle is a bearish chart pattern characterized by a flat horizontal support level and a descending trendline formed by a series of lower highs. Price compresses between these two boundaries, creating a visual triangle that slopes downward as buyers become progressively weaker while sellers continue to apply pressure at lower and lower levels. The pattern tells a clear story: buyers are defending a specific price level, but their conviction is fading with each rally attempt, while sellers grow more aggressive over time. Eventually, the support that buyers have defended breaks down, typically producing a significant move lower.
Why This Pattern Signals Bearish Pressure
The descending triangle pattern reveals a specific power dynamic between buyers and sellers that favors the bears.
Why the descending triangle indicates bearish conditions:
-
Each rally fails at a lower price than the previous rally, showing sellers stepping in earlier and more aggressively
-
The flat support level suggests buyers are only willing to defend one specific price, not accumulate at higher levels
-
The compression of price into a narrowing range represents building pressure that typically resolves downward
-
Volume usually declines during formation, indicating buyer exhaustion rather than seller exhaustion
-
The pattern's structure shows demand weakening over time while supply remains constant or increases
-
When support finally breaks, trapped buyers who defended that level become sellers, accelerating the move
The Appeal of Well-Defined Setups
The descending triangle pattern offers traders clear structure with defined entry points, stop levels, and profit targets.
Trading well-defined patterns like the descending triangle provides specific advantages. The horizontal support gives you an exact level to watch for the breakdown. The pattern's height provides a measured move target. The descending trendline tells you where the pattern would be invalidated if price breaks upward instead. This clarity removes ambiguity from trade planning and allows you to define risk before entering.
What This Article Covers
This article explains how to identify, validate, and trade the descending triangle pattern effectively.
Topics this article will explain:
-
The anatomy of the descending triangle including required touches and volume characteristics
-
The psychology behind why descending triangles form and what breakdowns reveal about supply and demand
-
How to determine whether a descending triangle signals continuation or reversal based on context
-
Criteria for identifying valid patterns worth trading
-
Entry strategies, stop placement, and profit target calculation for breakdown trades
-
How to handle false breakdowns, which occur with this pattern
-
When descending triangles break upward instead of down and how to respond
-
Variations of the pattern and common mistakes traders make
Anatomy of the Descending Triangle
The descending triangle consists of two converging trendlines that create a distinctive shape on the chart. Understanding each structural component helps you identify valid patterns and avoid trading formations that look similar but lack the characteristics that make descending triangles reliable. The pattern's power comes from what it represents—a clear visual display of sellers gaining control while buyers exhaust themselves defending a single price level.
Components of a valid descending triangle:
-
Horizontal support forms the lower boundary, created by at least two price lows at approximately the same level
-
This support line should be genuinely flat, not sloping—significant slope indicates a different pattern type
-
The descending trendline forms the upper boundary, connecting at least two lower highs
-
Each rally peak fails at a lower price than the previous peak, creating the downward-sloping resistance
-
Price oscillates between the two boundaries, compressing into an increasingly narrow range as the lines converge
-
The pattern requires time to develop—triangles forming over weeks carry more significance than those forming over hours
-
Minimum validation requires at least two touches on support and two lower highs forming the descending trendline
-
Three or more touches on each boundary creates stronger patterns with higher probability breakdowns
-
Volume typically declines during formation as the range narrows and participation wanes
-
Decreasing volume suggests energy building for the eventual breakdown rather than active battle throughout
Volume Characteristics
Volume behavior during descending triangle formation provides clues about what's happening beneath the surface and how likely a breakdown becomes.
Healthy descending triangles show declining volume as price compresses, indicating that the consolidation is tightening and a resolution approaches. This volume contraction suggests that both buyers and sellers are waiting for confirmation before committing. When the breakdown occurs, volume should expand meaningfully—this surge confirms that the move has genuine participation rather than occurring in a vacuum. A breakdown on low volume suggests potential for a false move and quick reversal back into the pattern. The volume pattern essentially tells you whether traders are engaged with the breakdown or whether it's happening without conviction.
Validating the Pattern
Not every price compression with a flat bottom qualifies as a tradeable descending triangle—validation requires specific characteristics.
IF price touches support twice but only creates one lower high… THEN the pattern isn't fully formed yet, and you should wait for additional structure before considering it valid.
IF the upper boundary shows similar highs rather than distinctly lower highs… THEN you're looking at a rectangle or range rather than a descending triangle.
IF volume remains high throughout formation rather than declining… THEN the pattern may lack the compression dynamics that produce clean breakdowns.
IF volume contracts during formation and then expands significantly on the breakdown candle… THEN this confirms the descending triangle pattern was valid and the breakdown has genuine participation.
IF the pattern forms over just a few bars with minimal touches on each boundary… THEN the formation lacks the development time needed for significance.
IF price touches support three or more times while creating multiple lower highs with clear trendline structure… THEN you have a well-developed descending triangle with higher probability of producing a tradeable breakdown.
The Bottom Line: A valid descending triangle requires horizontal support with at least two touches, a descending trendline connecting at least two lower highs, declining volume during formation suggesting building pressure, and sufficient time for the pattern to develop meaning—rushing to trade patterns that haven't fully formed leads to lower probability setups and more frequent false breakdowns.
Psychology Behind the Descending Triangle


The descending triangle pattern tells a story of shifting power dynamics between buyers and sellers. What appears as simple geometric lines on a chart actually represents thousands of individual decisions, each one revealing something about conviction, fear, and the evolving balance of supply and demand. Understanding this psychology helps you see beyond the lines and recognize when the conditions that create the pattern are genuinely present versus when you're forcing pattern recognition onto random price action.
Sellers Becoming More Aggressive
The descending trendline of lower highs reveals sellers growing more confident and willing to act at progressively lower prices.
What the lower highs reveal about seller psychology:
-
In the first rally attempt, sellers wait for price to reach a certain level before stepping in
-
On the second rally, sellers don't wait as long—they begin selling at a lower price than before
-
Each subsequent rally sees selling pressure arrive earlier, creating the series of lower highs
-
This pattern indicates that sellers believe the stock is headed lower and want to establish positions before the drop
-
It also suggests that holders who want to exit are increasingly willing to accept lower prices rather than wait for rallies
-
The compression reflects growing seller urgency—each bounce becomes an opportunity to sell before things get worse
-
Meanwhile, buyers become less enthusiastic with each failed rally, reducing buying pressure at higher levels
Why Support Eventually Fails
The horizontal support represents a level where buyers have repeatedly stepped in, but each defense weakens their ability to defend again.
Every time price touches support and bounces, some of those buyers are now holding positions. They bought expecting the level to hold and price to rally—but the rallies keep failing at lower prices. With each touch of support, these trapped buyers grow more anxious. Some begin selling on rallies rather than holding for larger gains. Others tighten stops just below support. The pool of fresh buyers willing to defend the level shrinks because those who would have bought already have. Eventually, the selling pressure from the descending trendline meets exhausted buying at support, and the level gives way. When support breaks, all the buyers who defended that level become motivated sellers, accelerating the descent as their stops trigger and their conviction evaporates.
Keep In Mind: The descending triangle pattern represents a specific psychological battle where sellers grow progressively more aggressive while buyers exhaust themselves defending a fixed level—and understanding this dynamic helps you recognize why breakdowns typically produce meaningful moves, as trapped buyers convert to sellers the moment their defense line fails.
Descending Triangle as Continuation vs. Reversal


The descending triangle pattern can appear in two distinct contexts that affect its significance and how you should trade it. When the pattern forms during an established downtrend, it typically signals a pause before continuation lower—sellers catching their breath before the next leg down. When it forms after an extended uptrend or at a significant high, the same pattern can signal a major reversal as buying exhaustion leads to distribution and eventual breakdown. The pattern structure looks identical in both cases; context determines meaning.
Continuation Within Downtrends
When a descending triangle forms during an established downtrend, it represents consolidation within the larger bearish move rather than a shift in direction.
The preceding trend has already established that sellers control the market. The descending triangle becomes a rest stop where some profit-taking occurs and buyers attempt to establish a floor, but the larger forces remain bearish. These continuation patterns tend to resolve relatively quickly and break down in alignment with the prior trend. The breakdown confirms that the consolidation was merely a pause, not a reversal, and the downtrend resumes. Continuation descending triangles often produce measured moves that match the pattern's height, adding to whatever decline preceded the pattern.
Reversal at Potential Tops
Descending triangles forming after extended uptrends or at significant resistance can signal major trend reversals with substantial downside implications.
Characteristics of reversal descending triangles:
-
The pattern forms after a significant uptrend or extended rally
-
Price reaches a new high or tests major resistance before the pattern begins
-
The flat support represents the last defense by bulls who bought the uptrend
-
Volume patterns may show distribution with higher volume on down moves within the pattern
-
The pattern takes longer to form as the transition from bullish to bearish requires more time
-
The breakdown carries greater significance because it signals a trend change, not just continuation
-
Measured move targets often underestimate the actual decline when major reversals occur
Reading Context for Clues
The same descending triangle pattern structure can signal very different outcomes depending on where it appears in the larger price structure.
IF the descending triangle forms after a multi-month downtrend as a brief consolidation… THEN it's likely a continuation pattern, and the breakdown should resume the established bearish trend.
IF the pattern forms at all-time highs or after an extended rally with signs of buying exhaustion… THEN it may signal a significant reversal, and the breakdown could initiate a major trend change.
IF volume during the uptrend was declining while price made new highs before the triangle formed… THEN distribution was already occurring, increasing the probability that the pattern marks a reversal.
IF the descending triangle appears at a major support level from a higher timeframe… THEN the breakdown may fail or produce only a limited move before buyers from the larger context step in.
IF the pattern forms quickly with minimal touches within a volatile downtrend… THEN it's likely a continuation pause, and aggressive breakdown trading may be appropriate.
IF the pattern takes many weeks to form with multiple touches and declining volume… THEN larger forces are at work, and the eventual breakdown may produce a more significant move.
Remember: The descending triangle pattern can signal either continuation of an existing downtrend or reversal of an uptrend, and reading the preceding context—including trend direction, pattern location, volume characteristics, and formation time—provides clues about which interpretation applies, though confirmation should come from the breakdown itself rather than prediction alone.
Identifying Valid Descending Triangle Patterns


Not every price compression with lower highs qualifies as a tradeable descending triangle. Traders often see patterns where none exist, forcing trades on formations that lack the structural validity required for reliable breakdowns. Developing strict criteria for what constitutes a valid descending triangle prevents you from trading every downward-sloping consolidation and focuses your attention on patterns with genuine potential. The best patterns are obvious—if you have to squint or make excuses for why a formation qualifies, it probably doesn't.
Criteria for identifying valid descending triangle patterns:
-
Horizontal support must be clearly defined with at least two touches at approximately the same price level
-
The support line should be genuinely flat, not sloping downward—any significant slope indicates a falling wedge or channel instead
-
Touches on support should produce visible bounces, not just brief wicks that immediately reverse
-
The descending trendline must connect at least two distinct lower highs, with three or more creating stronger patterns
-
Each lower high should be clearly below the previous high, forming an obvious downward slope
-
The trendline should fit the highs naturally without forcing or cherry-picking which peaks to connect
-
Price should oscillate between the two boundaries, showing genuine interaction with both lines
-
Time spent in formation matters—patterns developing over multiple weeks carry more significance than those forming over hours
-
Longer formation periods allow more traders to recognize the pattern, creating more orders clustered at the boundaries
-
Volume should decline during formation as the range narrows and the pattern compresses
-
Declining volume suggests building pressure for eventual breakdown rather than active distribution throughout
-
The pattern should be visible on clean charts without requiring indicators or overlays to identify
-
The height of the triangle should be meaningful relative to the security's typical movement
Distinguishing from Similar Patterns
Several chart patterns look similar to descending triangles but have different characteristics and trading implications.
A falling wedge has both boundaries sloping downward rather than one flat and one descending, creating different breakdown dynamics and often signaling bullish rather than bearish resolution. A descending channel has parallel boundaries rather than converging ones, lacking the compression that drives triangle breakdowns. A bear flag forms more quickly with a steeper angle and represents a brief pause rather than extended consolidation. A symmetrical triangle has both a descending upper boundary and an ascending lower boundary, creating more neutral bias compared to the bearish implications of the descending triangle. The key distinction is that descending triangles specifically feature flat horizontal support combined with a descending trendline of lower highs—any deviation from this structure requires different analysis.
Think of it this way: A valid descending triangle pattern shows buyers defending one specific price level while sellers grow progressively more aggressive at lower prices, creating clear horizontal support and a descending trendline that converge over time with declining volume—any pattern that doesn't fit this specific description belongs in a different category and demands different trading tactics.
Trading the Breakdown


Once you've identified a valid descending triangle pattern, executing the breakdown trade effectively requires attention to timing, risk management, and profit targets. The pattern provides clear structure for trade planning—the support level defines your trigger, the trendline suggests where invalidation occurs, and the pattern height gives you a measured move target. But the mechanics of entering, managing risk, and taking profits determine whether you capture the move or get whipsawed by false breakdowns.
How to trade the descending triangle breakdown:
-
Wait for price to close below horizontal support rather than entering on the first tick through the level
-
A close below support confirms that sellers controlled the entire bar, not just a brief intraday probe
-
Consider the strength of the breakdown candle—a strong, full-bodied candle suggests more conviction than a weak close barely below support
-
Volume should expand on the breakdown, confirming genuine participation rather than a low-volume failure
-
Alternatively, wait for a retest of the broken support level, which often becomes resistance after the breakdown
-
Retests offer better risk-reward entry points but don't always occur—some breakdowns run immediately
-
Place stops above the descending trendline, which defines where the pattern would be invalidated
-
Some traders use tighter stops just above the broken support level, accepting more frequent stops for better risk-reward
-
Calculate the profit target by measuring the height of the triangle at its widest point
-
Project this distance downward from the breakdown point to establish your measured move target
-
Consider taking partial profits at the measured move target while trailing the remainder for potential extension
-
Size positions so that the distance to your stop represents your predetermined risk per trade
-
Only take trades where the measured move target provides at least 2:1 reward relative to stop distance
Entry Approach Selection
Different entry methods suit different trading styles and offer distinct tradeoffs between capturing moves and avoiding false breakdowns.
DO consider your trading style when choosing between aggressive breakdown entries and conservative retest entries.
DO use volume as a filter, requiring above-average volume on the breakdown candle before entering.
DO accept that aggressive entries catch more of the move but experience more false breakdowns.
DO recognize that waiting for retests improves risk-reward but means missing breakdowns that run immediately.
DO define your entry approach before the breakdown occurs so you're not making decisions under pressure.
DO ensure your stop placement respects the pattern structure rather than arbitrary price distances.
DON'T enter on the first tick below support without waiting for at least a candle close.
DON'T ignore volume—a breakdown on weak volume has significantly higher failure probability.
DON'T use stops so tight that normal volatility triggers them before the pattern has a chance to work.
DON'T skip the measured move calculation—the descending triangle pattern provides a built-in target method.
DON'T size positions based on how confident you feel rather than on defined risk parameters.
The Bottom Line: Trading the descending triangle breakdown requires choosing between aggressive entry on the breakdown candle and conservative entry on a retest, placing stops above the pattern's trendline or broken support level, targeting the measured move based on pattern height, and sizing positions so that risk per trade remains consistent regardless of the specific setup.
False Breakdowns and How to Handle Them


False breakdowns are an unavoidable reality of trading descending triangles. Price breaks below support, triggers short entries, then reverses back into the pattern—sometimes continuing all the way to an upside breakout instead. This isn't a flaw in the pattern; it's a predictable feature of how consolidation structures resolve. Understanding why false breakdowns occur and developing strategies to handle them separates traders who profit from descending triangles over time from those who get chopped up by repeated fakeouts.
Why false breakdowns occur with descending triangles:
-
Stops cluster just below obvious support levels, creating liquidity pools that larger players target
-
Breakdown traders enter predictably when support breaks, providing counterparties for those engineering the false move
-
The horizontal support is visible to everyone, making stop placement obvious and exploitable
-
Some breakdowns fail simply because the first attempt lacks sufficient selling pressure to sustain the move
-
Market makers and algorithms probe below support to trigger stops before reversing
-
The buyer exhaustion implied by the pattern hasn't fully materialized yet, leaving enough demand to absorb selling
-
News or events can spike price through support temporarily without changing underlying dynamics
Identifying Potential False Breakdowns
Certain characteristics distinguish weak breakdowns likely to fail from strong breakdowns likely to continue.
Low volume on the breakdown candle is the most reliable warning sign. Genuine breakdowns attract participation; false ones don't. A breakdown on volume significantly below average suggests lack of conviction and increases the probability of reversal. Similarly, breakdowns that barely close below support with long lower wicks often fail—the wick shows buyers already stepping in. Breakdowns during low-liquidity periods like pre-market or lunch hours carry higher failure risk. And if the breakdown contradicts larger context—like a descending triangle forming at major support within a longer-term uptrend—the probability of failure increases.
Using Volume to Confirm
Volume provides the most reliable confirmation of whether a descending triangle breakdown represents genuine selling pressure or a likely false move.
Quick tip: Compare breakdown volume to the average volume during the pattern formation—genuine breakdowns typically show volume at least 50% above this average, often more.
Quick tip: Watch volume on the candles immediately following the breakdown—if volume collapses after the breakdown candle, the move lacks follow-through conviction.
DON'T assume that a close below support guarantees the breakdown is real—price can close below support and still reverse.
DON'T average into a short position that's moving against you after a suspected false breakdown—accept the stop and re-evaluate.
Re-Entry After False Breakdowns
False breakdowns don't have to end your involvement with a descending triangle pattern—they often provide even better trading opportunities.
Re-entry approaches after false breakdowns:
-
Wait for price to return inside the pattern and watch for a second breakdown attempt, which often succeeds after the first fails
-
The false breakdown may have cleared out weak holders, leaving less supply to absorb on the next attempt
-
Watch for an upside breakout instead if the false breakdown showed strong buying—the pattern may resolve opposite to expectation
-
A failed breakdown that quickly reverses into an upside breakout can produce powerful moves as trapped shorts cover
-
Consider the false breakdown information about support strength—if buyers defended aggressively, the level matters more than you thought
-
Reduce position size on re-entry attempts, acknowledging that the pattern has already produced one false signal
-
Set tighter stops on re-entries since you now have more information about where buying emerged
Remember: False breakdowns are an inherent part of trading the descending triangle pattern, not evidence that your analysis was wrong—using volume to confirm breakdowns, recognizing warning signs of potential fakes, and having re-entry strategies ready transforms false breakdowns from account damage into additional information and potential second-chance opportunities.
Trading Descending Triangles to the Upside


The descending triangle carries bearish expectations, but patterns don't always resolve in the expected direction. Sometimes buyers absorb all the selling pressure implied by the lower highs, defend support successfully, and ultimately break the pattern to the upside. When this happens, the failed bearish setup can produce surprisingly powerful bullish moves. Rather than viewing upside breakouts as annoying exceptions to the bearish rule, smart traders recognize them as opportunities that carry their own edge—precisely because so many traders are positioned for the opposite outcome.
Why Upside Breakouts Can Be Powerful
When a descending triangle breaks up instead of down, the positioning of most traders creates fuel for an extended move.
Why failed descending triangles produce strong upside moves:
-
Traders expecting the breakdown have positioned short or are waiting to short the break of support
-
When price breaks the descending trendline instead, these shorts must cover, adding buying pressure
-
Traders waiting to short the breakdown now chase the upside move, further accelerating the rally
-
The pattern's bearish reputation means fewer traders are positioned long, creating imbalance when direction reverses
-
The multiple tests of support without breakdown demonstrate that buyers are stronger than the pattern suggested
-
Each lower high that formed the descending trendline represented selling that has now been absorbed
-
The breakout invalidates the bearish thesis, triggering position reversals and new long entries simultaneously
Adjusting Strategy for Unexpected Direction
Trading the upside breakout of a descending triangle requires different tactics than trading the expected breakdown.
Entry occurs when price breaks above the descending trendline, ideally with a strong candle and expanding volume. The trendline that previously acted as resistance becomes your reference for stop placement—stops go below the trendline or below the most recent swing low within the pattern. The measured move target uses the same calculation as the breakdown: the height of the triangle projected from the breakout point, but now projected upward rather than downward. Position sizing follows the same principles as any trade, with the distance to your stop determining how many shares or contracts you take based on your risk parameters.
Using the Failed Pattern as Information
The failure of an expected breakdown tells you something meaningful about supply and demand that should inform future analysis.
IF a descending triangle tests support multiple times without breaking down… THEN buyers at that level are stronger than the pattern's bearish structure suggested.
IF price breaks above the descending trendline on strong volume… THEN the shorts who positioned based on bearish expectations are now trapped and will provide fuel for the move.
IF the upside breakout occurs after a false breakdown that quickly reversed… THEN the failed breakdown cleared out weak longs and trapped aggressive shorts, creating conditions for a powerful rally.
IF the descending triangle formed within a larger uptrend and breaks upward… THEN the pattern was consolidation within the trend rather than a reversal signal, and the primary trend has resumed.
IF you were positioned short based on the bearish expectation and got stopped out… THEN consider whether the new information justifies reversing to a long position rather than simply exiting.
The unexpected resolution of a descending triangle provides valuable information about who controls the stock. The bearish structure suggested sellers were winning, but the upside breakout proves that buyers absorbed the selling and emerged stronger. This information applies beyond the immediate trade—it tells you something about the stock's character and the conviction of buyers at current levels.
Keep In Mind: Descending triangles break upward more often than their bearish reputation suggests, and these failed patterns often produce powerful moves because so many traders are positioned for the opposite outcome—treating unexpected upside breakouts as opportunities rather than annoyances allows you to profit from the pattern regardless of which direction it ultimately resolves.
Descending Triangle Variations


The textbook descending triangle features perfectly horizontal support, a clean descending trendline, and obvious structure. Real markets rarely produce textbook patterns. Most descending triangles you encounter will have some variation from the ideal—slight slope to the support, internal structure that complicates the simple compression, or nesting within larger consolidation patterns. Understanding these variations helps you recognize descending triangles in their real-world forms rather than dismissing valid setups because they don't match perfect examples.
Descending Triangles with Sloped Support
Sometimes the support level in a descending triangle shows a slight slope rather than being perfectly horizontal, creating a pattern that still carries bearish implications but requires adjusted analysis.
Characteristics of slightly sloped variations:
-
Support that slopes slightly downward creates a falling wedge appearance, but with the upper boundary falling more steeply
-
If both boundaries are descending but the upper boundary descends more steeply, the pattern still shows sellers gaining control
-
Slightly upward-sloping support with a descending upper boundary creates even stronger bearish implications—buyers are defending higher each time yet rallies still fail at lower prices
-
The key distinction remains the relationship between boundaries: sellers growing more aggressive (lower highs) while buyers defend a relatively fixed area
-
Measure the pattern height from the highest high to the support level at the same point in time for target calculation
-
Allow for slight imperfection in support—perfectly horizontal lines are rare in actual markets
-
If support slopes significantly, the pattern may be better classified as a wedge or channel with different trading implications
Timeframe Considerations
Descending triangles appear across all timeframes, but their significance and trading implications vary based on the chart period.
Timeframe variations to consider:
-
Intraday descending triangles on 5-minute or 15-minute charts form quickly and may resolve within a single session
-
These short-term patterns carry less significance and produce smaller measured moves but offer more frequent opportunities
-
Daily chart descending triangles develop over weeks and carry substantial significance when they break down
-
Weekly chart patterns can take months to form and represent major distribution phases with significant downside targets
-
Higher timeframe patterns generally produce more reliable breakdowns with larger percentage moves
-
Lower timeframe patterns experience more noise and false breakdowns but allow more active trading
-
Consider the timeframe context—a descending triangle on a 5-minute chart means little if the daily chart shows a strong uptrend
-
Multi-timeframe alignment, where descending triangles appear on multiple timeframes simultaneously, increases conviction
Nested Triangles and Internal Structure
Descending triangles sometimes contain smaller patterns within them, or form inside larger consolidation structures, creating nested dynamics that can signal imminent resolution.
A descending triangle may show internal structure where smaller triangles, flags, or ranges form within the larger pattern as price compresses toward the apex. These internal patterns often precede the larger breakout, serving as a signal that resolution approaches. When a smaller descending triangle forms near the support of a larger descending triangle, the eventual breakdown can be particularly powerful as multiple layers of consolidation resolve simultaneously. Conversely, a descending triangle may form within an even larger pattern—like a rectangle or channel—adding context about the larger structure that should influence your targets and expectations. The key is recognizing that patterns exist within patterns, and the outer structure often determines the ultimate significance of the move once inner patterns resolve.
Common Descending Triangle Trading Mistakes


The descending triangle offers clear structure and defined trading mechanics, yet traders consistently make the same errors that undermine their results. These mistakes typically stem from impatience, wishful thinking, or applying logic that works for other setups but fails with consolidation patterns. Recognizing these common pitfalls before you make them saves both capital and frustration, allowing you to trade descending triangles the way the pattern actually behaves rather than how you wish it would behave.
Common mistakes when trading descending triangle patterns:
-
Anticipating the breakdown too early, committing to a short position before the pattern has provided confirmation
-
Assuming that because the pattern is bearish, the breakdown is guaranteed, and positioning before support actually breaks
-
Shorting before confirmation, entering on the first touch of support rather than waiting for a close below the level
-
Chasing weak breakdowns that barely close below support, only to get caught in immediate reversals
-
Using stops too tight for the pattern's volatility, placing stops just above support where normal oscillation will trigger them
-
Setting stops based on arbitrary dollar amounts rather than levels defined by the pattern's structure
-
Ignoring volume on the breakdown, entering regardless of whether participation confirms the move
-
Treating all breakdowns equally when low-volume breakdowns have significantly higher failure rates
-
Trading descending triangles in low-liquidity securities where price can gap through stops and execution quality suffers
-
Applying pattern strategies to thinly traded stocks where the formation may be noise rather than meaningful structure
-
Forcing descending triangle identification on price action that doesn't meet the criteria, seeing patterns that aren't there
-
Trading the same pattern repeatedly after multiple failures rather than accepting that this particular setup isn't working
-
Sizing positions too large because the pattern's bearish structure makes the trade feel certain
-
Failing to adjust expectations when the triangle is a variation rather than a textbook formation
-
Ignoring the larger context, shorting a descending triangle that forms within a strong larger uptrend
Avoiding These Pitfalls
Most descending triangle trading mistakes come from wanting the pattern to resolve faster, more predictably, or more profitably than consolidation structures actually behave.
The cure for anticipating too early is waiting for the actual breakdown rather than predicting. The cure for shorting before confirmation is requiring a close below support, volume expansion, or a successful retest of the broken level. The cure for stops too tight is respecting the pattern's structure and sizing positions so that properly placed stops represent acceptable risk. The cure for ignoring volume is making volume confirmation a non-negotiable part of your breakdown criteria. The cure for low-liquidity problems is simply avoiding descending triangle trades in securities without sufficient trading activity. Each mistake has a straightforward solution, but implementing those solutions requires accepting that pattern trading demands patience, confirmation, and respect for the inherent uncertainty rather than forcing certainty onto a structure that resolves on its own timeline.
Making the Descending Triangle Pattern Work for You


The descending triangle pattern offers a clear visual representation of bearish pressure building toward resolution. The structure tells an unmistakable story: sellers growing more aggressive with each rally attempt while buyers exhaust themselves defending a single price level. When that defense finally fails, the trapped buyers become sellers, and the move accelerates. This narrative gives the pattern its edge—not because breakdowns are guaranteed, but because when they occur, the psychology driving them creates momentum that produces tradeable moves. Understanding the pattern as a pressure indicator rather than a prediction machine helps you approach it with appropriate expectations.
Building Pattern Recognition Into Your Analysis
Adding descending triangle awareness to your regular market analysis expands your opportunity set while helping you identify shorts with favorable risk-reward structures.
Train yourself to recognize when price is building a descending triangle rather than randomly consolidating—this awareness alone helps you prepare for potential breakdowns before they occur. Scan your watchlist periodically for developing patterns, noting formations that haven't yet completed but may offer opportunities when they resolve. Mark the support levels and descending trendlines on your charts so you're prepared when breakdowns occur rather than scrambling to analyze in real-time. Accept that descending triangles require patience—sometimes days, sometimes weeks—and that waiting for proper confirmation is part of the strategy rather than wasted time. Maintain realistic expectations that even valid patterns produce false breakdowns, that measured move targets are projections rather than guarantees, and that upside resolutions happen more often than the bearish reputation suggests. The descending triangle pattern offers genuine opportunity for traders willing to respect its structure, wait for confirmation, and manage risk appropriately, but it offers only frustration for those who demand certainty and immediate gratification from a formation built around compression and eventual release.
