


The Bearish Harami: Reading Indecision Before the Fall


Markets don't always announce their intentions with dramatic candles and explosive volume. Sometimes the most telling signals are quiet ones—moments when momentum doesn't continue as expected, when the relentless buying pressure simply... stops. These pauses matter because they reveal something shifting beneath the surface, a hesitation that often precedes larger moves. The traders who catch these subtle warnings get out before the crowd realizes something has changed, while everyone else is still celebrating gains that are about to evaporate.
What the Bearish Harami Actually Tells You
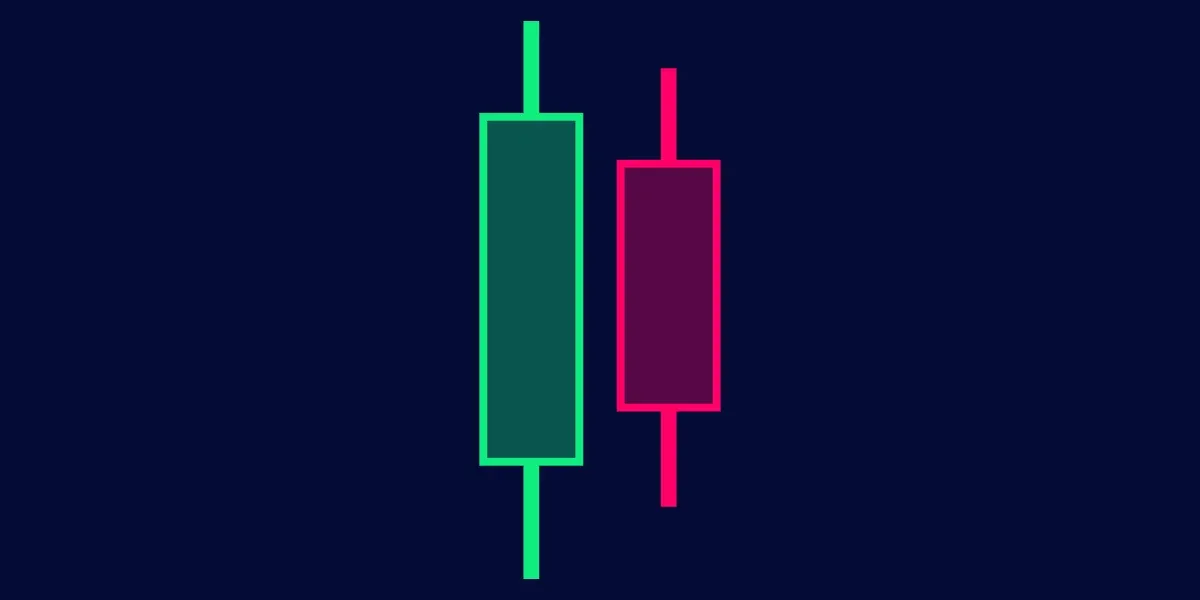
The bearish harami is a two-candle reversal pattern that appears after upward price movement and signals indecision or exhaustion among buyers. The pattern gets its name from the Japanese word for "pregnant" because the second small candle sits inside the body of the first large candle, like a baby in the womb. What makes this pattern meaningful isn't drama or aggression—it's the absence of follow-through. After a strong bullish candle pushes prices higher, the next session produces a small-bodied candle that stays completely within the range of the previous day. Buyers couldn't maintain their momentum, and that failure to continue often precedes reversals.
Why This Pattern Deserves Your Attention
The bearish harami won't impress you with its appearance on a chart. Compared to patterns like the bearish engulfing or three outside down, it looks underwhelming and easy to dismiss. But that's exactly why it works when traders pay attention to it:
-
It appears earlier in the reversal process than more aggressive patterns, giving advance warning before major selling begins
-
The pattern identifies moments when buying pressure exhausts itself, even if sellers haven't fully taken control yet
-
It works across all timeframes and market conditions, making it a versatile tool for different trading styles
-
The subtle nature means fewer traders react to it immediately, providing better entry prices for those who recognize it
-
When combined with proper confirmation, the pattern offers favorable risk/reward setups at the beginning of trend changes
The Bearish Harami pattern reveals something more valuable than dramatic reversals—it shows you the exact moment when momentum dies and the market pauses before changing direction, giving informed traders an edge over those waiting for obvious signals.
Understanding the Bearish Harami Structure


At its foundation, the bearish harami is a two-candle bearish reversal pattern where a small-bodied candle appears completely within the real body of the previous large bullish candle. The term "harami" comes from Japanese candlestick charting and translates to "pregnant," which makes perfect sense when you look at the visual—the second candle sits inside the first like an unborn child. This containment is what gives the pattern its meaning. Instead of buyers pushing prices to new highs and continuing the upward momentum, they produce a small, indecisive candle that shows exhaustion or uncertainty. The pattern doesn't scream reversal like some formations do, but it whispers a warning that should make attentive traders reconsider their bullish positions.
Breaking Down the Two-Candle Formation
The bearish harami requires specific structural elements to qualify as a valid pattern. The first candle must be a large bullish candle with a substantial body, representing strong buying pressure and continuation of the uptrend. This candle shows buyers in complete control, pushing prices higher with conviction. The second candle is where things change—it must open and close entirely within the body of the first candle, meaning both its open and close fall between the first candle's open and close. The second candle's color can be either bullish or bearish, though a bearish second candle adds slightly more weight to the reversal signal:
IF the second candle is bearish (closes lower than it opened), THEN the pattern suggests not just indecision but actual selling pressure beginning to emerge.
IF the second candle is bullish but very small-bodied, THEN buyers are still present but lack the strength to continue the previous day's momentum.
IF the second candle appears as a Doji (open equals close), THEN you have maximum indecision and the pattern becomes even more significant.
IF the first candle is exceptionally large, THEN the contrast with the small second candle becomes more dramatic and meaningful.
IF the second candle's range is tiny compared to recent volatility, THEN this suggests buyers have completely exhausted themselves after the previous push.
Where You'll Find This Pattern
The bearish harami doesn't appear randomly on your charts—it shows up in specific contexts where its message of indecision and exhaustion makes the most sense. Location determines whether the pattern is worth trading or just noise in sideways movement:
-
After sustained uptrends where buyers have pushed prices significantly higher over multiple sessions
-
Following strong rally days or even parabolic moves that may have overextended
-
Near resistance levels where price has previously struggled to break through
-
At psychological round numbers where selling pressure historically appears
-
After gaps up that fail to attract additional buying interest
-
During the final stages of bullish momentum before trend exhaustion sets in
The Bottom Line: The bearish harami works because it captures the moment when bullish momentum falters and indecision replaces conviction, appearing at locations where uptrends are most vulnerable to losing steam and potentially reversing.
The Two Candles Explained


Each candle in the bearish harami tells a distinct part of the story about changing market dynamics. Understanding what's happening during each trading session helps you recognize not just the visual pattern, but the actual battle between conviction and doubt playing out in real time. This isn't abstract pattern recognition—each candle represents real decisions made by real traders with real money, and those decisions reveal whether momentum can continue or if exhaustion is setting in.
The First Candle: Bullish Conviction in Full Force
The first candle is a large bullish candle that demonstrates buyers are firmly in control. This candle typically shows strong momentum as price moves substantially higher from open to close, often with decent volume backing the move. Bulls are confident, the trend appears healthy, and there's no immediate indication that anything is about to change. This candle often attracts late buyers who see the strength and want to participate in what looks like a continuing rally. The larger the body of this candle, the more dramatic the contrast becomes when the second candle fails to deliver follow-through. This first candle represents optimism, momentum, and the expectation that higher prices will continue—which makes the second candle's failure all the more significant.
The Second Candle: The Baby That Signals Trouble
The second candle is where the bearish harami gets interesting. This small-bodied candle opens and closes entirely within the range of the first candle's body, creating that "pregnant" visual that gives the pattern its name. What makes this containment meaningful is what it reveals about buyer exhaustion:
-
The opening shows some continuation of sentiment from the previous session
-
The small body indicates neither buyers nor sellers could dominate the session
-
The containment within the first candle shows buyers couldn't push to new highs despite the previous momentum
-
The reduced range suggests energy and conviction have drained from the move
-
Whether the candle is bullish or bearish matters less than the fact that it's small and indecisive
-
Volume often decreases on this candle, confirming the lack of participation and conviction
What This Containment Actually Means
The containment of the second candle inside the first isn't just a visual quirk—it's a message about momentum death. After a strong bullish day, the market should theoretically continue higher if the trend is healthy and buyers remain committed. Instead, the next session produces a small, constrained candle that goes nowhere. This tells you that buyers from the previous day couldn't attract additional interest, and the momentum that seemed so strong has simply evaporated. Think of it like a car accelerating hard and then suddenly coasting—the engine isn't pushing anymore. The bearish harami captures that moment when the pushing stops but before the actual reversal begins. Sellers haven't necessarily taken control yet, but buyers have clearly lost theirs. This indecision creates vulnerability because without continued buying pressure to support elevated prices, even modest selling can tip the balance and trigger a reversal.
The power of the bearish harami lies in its ability to identify momentum exhaustion before aggressive selling begins—the small second candle reveals that buyers can't maintain the previous session's strength, creating the conditions for reversal even before sellers fully engage.
Identifying Valid Bearish Harami Patterns


Not every small candle following a large bullish candle qualifies as a tradeable bearish harami. The difference between a legitimate pattern and random price noise comes down to specific criteria that separate meaningful signals from wishful thinking. You need clear standards that eliminate ambiguity and keep you from trading setups that only vaguely resemble the pattern. Here's what actually makes a valid bearish harami:
-
A clear uptrend or upward price movement must precede the pattern—sideways consolidation doesn't count
-
The first candle must be a large-bodied bullish candle showing strong momentum and conviction
-
The second candle's body must be completely contained within the first candle's body (open and close both inside)
-
The second candle should be noticeably smaller than the first, ideally less than half the size
-
Shadows on the second candle can extend outside the first candle's body—only the bodies matter for containment
-
The pattern should form as a distinct two-candle sequence, not part of choppy, overlapping price action
Size Matters: The Contrast Between Candles
The relationship between the two candles determines how strong the indecision signal actually is. A massive bullish candle followed by a tiny indecisive one sends a clearer message than two similar-sized candles where the second just happens to fit inside the first. The more dramatic the size difference, the more obvious the momentum failure becomes. When the first candle shows powerful buying and the second candle barely moves, that contrast tells you something changed between sessions—buyers who were aggressive yesterday are now hesitant or absent. Some traders require the second candle to be less than 50% of the first candle's body, while others are more flexible. The key is recognizing that small differences in size produce weak signals while dramatic differences produce patterns worth your attention.
The Color Question: Does It Actually Matter?
Here's something that confuses traders new to the bearish harami: the second candle can be either bullish or bearish, and both versions qualify as valid patterns. A bearish second candle (closing lower than it opened) adds slightly more weight to the reversal signal because it shows sellers at least won the session, even if by a small margin. A bullish second candle (closing higher than it opened) still works because the pattern is fundamentally about indecision and containment, not outright selling. What matters most is that the candle is small and stays within the first candle's range, revealing the absence of follow-through. That said, if you're going to be selective about which bearish harami patterns you trade, favoring those where the second candle is bearish gives you a marginal edge in reliability.
Context Clues That Separate Good Setups from Mediocre Ones
Pattern validity gets you in the door, but context determines whether a setup is actually worth trading. A technically perfect bearish harami in the wrong location or wrong market conditions still fails regularly:
-
Patterns at major resistance levels where price has failed before carry more weight than those in open space
-
Volume declining on the second candle confirms lack of participation and exhausted momentum
-
Patterns after extended uptrends or parabolic moves are more reliable than those after minor rallies
-
Overbought readings on RSI or Stochastic indicators when the pattern forms add confirmation
-
Multiple timeframe alignment—seeing weakness on higher timeframes supporting the pattern
-
Patterns near psychological round numbers where traders typically place sell orders
Common Pattern Identification Mistakes
Experience with the bearish harami teaches you where traders typically go wrong in recognizing these formations. These errors lead to trading invalid patterns or missing legitimate ones:
-
Ignoring the containment requirement and trading any small candle after a large one
-
Trading the pattern in sideways markets where there's no uptrend to reverse
-
Accepting partial containment where the second candle's body extends slightly outside the first
-
Overlooking the size relationship and trading patterns where the candles are similar in size
-
Forcing the pattern because you want to see it rather than because it actually exists on the chart
-
Entering immediately without waiting for confirmation, treating this weak signal like a strong one
-
Confusing the bearish harami with other patterns like inside bars that have different implications
How to Trade the Bearish Harami Pattern


Trading the bearish harami requires a different approach than more aggressive reversal patterns. This isn't the Bearish Engulfing or Three Outside Down where sellers decisively take control—it's a pattern of indecision and exhaustion that hints at reversal without guaranteeing it. That subtlety means you need to adjust your expectations, entry timing, and position sizing to match the pattern's actual reliability. Traders who approach the bearish harami with the same aggression they'd use for stronger patterns end up disappointed by inconsistent results and premature entries. The key is treating this as an early warning signal that requires validation rather than a definitive reversal you can trade immediately.
Entry Timing: When to Actually Pull the Trigger
The bearish harami's weaker signal strength makes entry timing more nuanced than with other patterns. Jumping in immediately after the second candle forms often leads to getting stopped out as price continues higher or consolidates sideways without reversing. The pattern shows momentum dying, but that doesn't mean the downtrend starts right away. Conservative traders wait for the third candle to break below the low of the pattern, providing concrete confirmation that sellers have actually engaged and price is moving lower.
This approach sacrifices some entry price in exchange for higher probability that the reversal is actually happening. Aggressive traders might enter on the close of the second candle or the open of the third, accepting the risk that the pattern could fail in exchange for better positioning if it works. The middle ground involves setting alerts when the pattern forms, then waiting to see if the next candle shows follow-through before committing capital. Whichever approach you choose, recognize that immediate entry on this pattern carries higher failure risk than waiting for validation.
The Confirmation Problem: Why You Can't Skip This Step
The bearish harami's message of indecision rather than reversal makes confirmation practically mandatory for consistent success. Without additional evidence that sellers are actually taking control, you're trading on hope rather than probability:
-
Wait for the third candle to close below the second candle's low before entering
-
Look for increased volume on the breakdown candle to validate seller commitment
-
Confirm with technical indicators like RSI divergence or MACD bearish crossovers
-
Check that the pattern forms at resistance or another technically significant level
-
Verify that higher timeframes support the bearish thesis rather than conflict with it
-
Consider waiting for a retest of the pattern high that fails, then enter on rejection
Stop Loss Placement and Risk Management
DO place your stop just above the high of the first candle (the large bullish one)—if price exceeds that level, the pattern has clearly failed and the uptrend continues.
DO consider using a percentage-based stop (1-2% above entry) on volatile stocks where pattern-based stops become too wide for your risk tolerance.
DO tighten your stop to breakeven once the trade moves in your favor by the amount you risked, protecting against giving back gains.
DON'T use the second candle's high as your stop—that's too tight and will get triggered by normal volatility before the pattern has a chance to work.
DON'T move your stop wider if price approaches it—the pattern is either valid or it isn't, and adding to risk after the fact rarely works.
DON'T skip the stop loss entirely thinking you'll "manage it mentally"—this pattern fails often enough that you need mechanical protection.
Setting Profit Targets for Realistic Expectations
The bearish harami typically produces smaller moves than aggressive reversal patterns because it catches the beginning of momentum shifts rather than moments of capitulation. Your profit targets should reflect this reality. Target the nearest support level below the pattern as your first exit point, recognizing that price may stall there before deciding whether to continue lower.
Using a measured move—taking the height of the first candle and projecting it downward from the breakdown point—gives you a mathematical target, though the pattern's nature means it hits these targets less consistently than stronger formations. A conservative approach takes partial profits at the first support level, then trails a stop on the remainder to capture extended moves if they develop. The risk/reward ratio should account for the pattern's lower reliability—aim for at least 2:1 or 3:1 to ensure that winners compensate for the inevitable failures this pattern produces.
Position Sizing: Matching Risk to Pattern Strength
Pro Tip: Reduce your standard position size by 30-50% when trading bearish harami patterns compared to what you'd risk on high-conviction setups like Three Outside Down or Bearish Engulfing.
Pro Tip: Calculate position size based on your stop distance and maximum acceptable loss per trade (typically 1% of account), but then further reduce it to account for the pattern's higher failure rate.
Pro Tip: If you normally risk 2% per trade on strong patterns, drop to 1% or less on bearish harami setups since they require more patience and produce more false signals.
Pro Tip: Consider the bearish harami as a "starter position"—enter with reduced size, then add to the position if confirmation develops and the trade moves in your favor.
When the Bearish Harami Pattern Fails


The bearish harami fails more often than most reversal patterns, and that's not a flaw—it's the nature of trading indecision signals rather than decisive reversals. This pattern catches momentum exhaustion early, which means you're often trying to call the top before clear selling pressure emerges. Sometimes exhaustion leads to reversal, but other times it just means consolidation before the uptrend resumes. Accepting that this pattern will fail regularly, even when you identify it correctly and trade it properly, keeps you from getting frustrated or abandoning an otherwise useful tool. The key is recognizing failure quickly and exiting before small losses become significant ones.
-
Price closes above the high of the first candle, negating the indecision signal and confirming buyers remain in control
-
The third candle after the pattern gaps up or produces a strong bullish close, showing renewed buying interest
-
Volume increases on upward movement following the pattern, indicating fresh capital entering long positions
-
Price consolidates sideways for multiple sessions without breaking down, suggesting the pause was just rest rather than reversal
-
The pattern forms but then immediately retests the highs and breaks through to new highs
-
Multiple attempts to break lower fail and price snaps back inside the pattern range repeatedly
Why This Pattern Has Higher Failure Rates
The bearish harami's reliability problem comes from what it actually signals versus what traders want it to signal. This pattern identifies indecision and momentum loss, but indecision doesn't automatically mean reversal. Markets can pause, consolidate sideways, and then resume the previous trend without ever producing the downward move you expected. The pattern lacks the aggressive selling pressure that stronger formations like Bearish Engulfing provide, which means you're trading on the absence of buying rather than the presence of selling. That's a weaker foundation for reversal predictions.
The small second candle shows buyers couldn't continue yesterday's momentum, but it doesn't prove sellers are ready to take over. Sometimes the market just needs to digest gains before continuing higher, and the bearish harami can't distinguish between healthy consolidation and genuine exhaustion without additional confirmation. This is why successful traders treat this pattern as a warning that requires validation rather than a standalone signal worth immediate action.
Reading the Continuation vs. Reversal Clues
The sessions immediately following the bearish harami reveal whether you're seeing actual reversal or just temporary pause. Learning to recognize these signals early helps you cut losses before patterns fully fail:
IF the third candle opens higher and maintains strength throughout the session, THEN the pattern is likely failing and the uptrend will continue—exit any short positions immediately.
IF volume increases on bullish candles following the pattern, THEN fresh buying interest suggests the pause was just consolidation and you're on the wrong side.
IF price breaks above the first candle's high on the third or fourth candle, THEN the pattern has clearly failed and continued uptrend is the most likely scenario.
IF the third candle produces another small-bodied indecisive candle, THEN you're seeing extended consolidation rather than reversal—consider exiting unless confirmation arrives soon.
IF price bounces off support below the pattern and reverses back into the range, THEN the initial breakdown was a false signal and the pattern is invalidated.
IF the third candle gaps down with volume, THEN confirmation is strong and the reversal has legitimate momentum—this is what success looks like.
Managing Trades When You're Wrong
Getting stopped out of bearish harami trades happens frequently enough that your response to losses determines long-term success with the pattern. How you handle being wrong matters more than how you celebrate being right:
-
Exit immediately when price closes above the first candle's high—don't wait for your stop to get hit if invalidation is clear
-
Avoid averaging down or adding to losing positions hoping the reversal will eventually materialize
-
Document why the pattern failed in your trading journal while details are fresh—was context weak, confirmation absent, or just bad luck?
-
Take a break before looking for the next setup rather than revenge trading to recover the loss quickly
-
Review whether you followed your rules properly or if emotional decisions contributed to the loss
-
Accept that even perfectly executed bearish harami trades fail 30-40% of the time, making losses a normal cost of using the pattern
-
Don't abandon the pattern entirely after a string of losses—evaluate if you're identifying and confirming properly before assuming the pattern doesn't work
Remember: The bearish harami's higher failure rate is a feature of catching reversals early rather than a bug—successful traders compensate for more frequent small losses with proper position sizing, strict confirmation requirements, and disciplined exits when invalidation signals appear.
Improving Bearish Harami Pattern Reliability


The bearish harami becomes significantly more effective when you stop treating it as a standalone signal and start using it as one piece of evidence in a larger case for reversal. The pattern's inherent weakness—signaling indecision rather than decisive selling—means you can't rely on it alone. Traders who consistently profit from this pattern aren't just better at spotting the formation, they're better at filtering for situations where the pattern has the highest probability of actually working. Small improvements in how you select setups, what confirmation you require, and when you're willing to trade can transform a mediocre pattern into a valuable tool.
-
Strong uptrends that have extended far from moving averages, making pullbacks or reversals more likely due to overextension
-
Markets showing overbought conditions on momentum indicators when the pattern forms
-
Lower volatility environments where subtle indecision signals carry more weight than in chaotic conditions
-
Near major resistance zones where sellers have previously defended price levels aggressively
-
After news-driven rallies that pushed price beyond rational levels, setting up technical corrections
-
During distribution phases when smart money exits positions while retail enthusiasm remains high
Technical Indicators That Add Confirmation Weight
Quick Tip: RSI divergence combined with bearish harami creates powerful setups—if price makes a higher high but RSI makes a lower high, the momentum loss signal becomes much stronger.
Quick Tip: MACD bearish crossovers occurring simultaneously with the pattern suggest momentum is genuinely shifting from bullish to bearish control.
Quick Tip: Price forming the bearish harami right at the upper Bollinger Band indicates overextension and increases reversal probability when combined.
Quick Tip: Stochastic indicators showing overbought readings (above 80) when the pattern appears confirm that the rally has exhausted itself.
Quick Tip: Moving average violations—when the breakdown from the pattern also breaks below key MAs like the 20 or 50—add significant confirmation to the reversal thesis.
Volume Analysis: What the Numbers Reveal
Volume patterns surrounding the bearish harami tell you whether the indecision is meaningful or just noise in an otherwise healthy trend. Pay attention to these volume characteristics:
-
High volume on the first large bullish candle followed by dramatically lower volume on the second candle confirms buying interest has dried up
-
Volume declining throughout the pattern formation suggests weakening participation and potential exhaustion
-
Volume expanding on the breakdown candle after the pattern provides confirmation that sellers are actually engaging
-
Consistent low volume on both pattern candles in an uptrend may indicate accumulation rather than distribution, reducing reliability
-
Volume spikes on attempts to push higher after the pattern that fail to make progress show bulls losing conviction despite effort
How Bearish Harami Compares to Similar Patterns
Understanding where the bearish harami fits among related patterns helps you choose the right tool for each situation and recognize which signals deserve more confidence:
-
Bearish Engulfing: More aggressive and reliable than bearish harami because the second candle completely swallows the first, showing sellers decisively overwhelming buyers rather than just indecision
-
Evening Star: Three-candle pattern where the middle candle gaps above the first, creating a stronger reversal signal than bearish harami's two-candle formation
-
Shooting Star/Gravestone Doji: Single-candle patterns showing rejection at highs with more immediate reversal implications than the gradual momentum loss of bearish harami
-
Dark Cloud Cover: Bears push deep into the previous bullish candle's body, showing more selling pressure than bearish harami's contained second candle
-
Doji Star: Similar structure to bearish harami but with the second candle opening at or above the first candle's close and forming a perfect Doji, indicating even stronger indecision
Common Trading Pitfalls to Avoid
Experience with the bearish harami teaches you where traders repeatedly make mistakes that turn potentially profitable setups into losses. These aren't theoretical errors—they're the actual habits that drain accounts:
-
Trading every bearish harami you spot rather than being selective about context, location, and confirmation quality
-
Entering without waiting for any validation, treating this weak pattern like a strong definitive signal
-
Using position sizes appropriate for high-conviction patterns rather than adjusting for the bearish harami's lower reliability
-
Ignoring what's directly above the pattern—resistance levels that could cap upside make bearish reversals more likely
-
Fighting the larger trend by trading bearish harami patterns against strong weekly or monthly uptrends
-
Expecting the same magnitude moves you get from aggressive reversal patterns when this one signals early and subtly
-
Refusing to exit when invalidation signals appear, hoping the pattern will eventually work if you just hold longer
The bearish harami transforms from a mediocre standalone signal into a reliable trading tool when you combine proper pattern identification with favorable market conditions, supporting technical indicators, volume confirmation, and realistic expectations about its strengths and limitations relative to more aggressive reversal patterns.
Performance and Realistic Expectations


If you're expecting the bearish harami to perform like the Bearish Engulfing or Three Outside Down, you're going to be disappointed. This pattern has a documented success rate somewhere between 50-65% depending on market conditions and confirmation requirements, which puts it firmly in the "useful but not spectacular" category. That's not a criticism—it's just reality. The pattern catches reversals early by identifying indecision, but early signals come with inherent uncertainty. Some of that indecision resolves into reversal, some resolves into continuation, and distinguishing between the two before it happens remains challenging even with experience. Understanding these limitations before you trade the pattern keeps you from abandoning it after normal losing streaks or over-leveraging positions when you shouldn't.
What the Numbers Actually Say
Statistical analysis of the bearish harami across thousands of occurrences shows that the pattern acts as a bearish reversal roughly 53-63% of the time in bull markets and slightly higher in bear markets where downward momentum already exists. These aren't impressive numbers compared to patterns like Three Outside Down that reverse successfully 75% of the time. The average post-pattern move is also more modest—typically 3-7% declines over the following 10-20 trading sessions rather than the dramatic selloffs that follow more aggressive formations. The pattern performs best when combined with additional confirmation factors, which can push success rates toward 70%, but at the cost of catching fewer total opportunities. The measure rule—projecting the pattern height downward from the breakdown point—hits target only about 40% of the time, warning you not to expect straight-line runs to predetermined targets. These statistics tell you that the bearish harami works, just not spectacularly, and that you need to adjust your trading approach to match its actual capabilities rather than your wishes.
Best and Worst Case Scenarios
Understanding the range of outcomes helps you prepare mentally and financially for what this pattern actually delivers rather than what you hope it will:
-
Best case: Pattern forms at major resistance after extended rally, confirmation arrives quickly, and price drops 10-15% over the next few weeks with minimal pullbacks
-
Typical success: Pattern signals reversal correctly, price drops 4-7% over next 10-15 sessions with choppy movement and one or two failed rally attempts along the way
-
Marginal win: Pattern works but produces only 2-3% decline before price stabilizes, barely hitting your profit target with risk/reward around 1:1
-
Common failure: Pattern forms, you enter with confirmation, but price consolidates sideways for days before breaking back upward and stopping you out for a small loss
-
Worst case: You enter too early without confirmation, price immediately resumes the uptrend, and you take a full stop loss while the rally continues without you
Why This Pattern Demands More Patience
The bearish harami requires a different mindset than trading aggressive reversal patterns. You're not catching capitulation or panic—you're catching the moment buyers stop pushing, which happens before sellers actively engage. That gap between momentum loss and actual reversal creates a waiting period that tests patience. After the pattern forms, price often consolidates for several sessions while the market decides what happens next. Traders accustomed to immediate gratification from patterns like Bearish Engulfing find this frustrating and often exit prematurely right before the reversal actually develops. The pattern also produces smaller total moves, which means you're working harder for less dramatic results. If you're the type of trader who needs action and quick feedback, the bearish harami will drive you crazy. But if you can tolerate the uncertainty and wait for confirmation, the pattern's early warning capability becomes valuable despite the modest moves it produces.
Pro Tip: Track your bearish harami trades separately from other patterns to understand its actual performance in your hands—you might discover it works better or worse for you than published statistics suggest, helping you decide how much weight to give it in your strategy.
The Bearish Harami: An Early Warning Worth Heeding


The bearish harami won't make you rich overnight, and it won't give you the satisfaction of catching dramatic reversals at their most obvious moments. What it does offer is something more subtle and potentially more valuable—advance notice that momentum is dying before most traders recognize it. This pattern identifies the pause before the fall, the indecision that precedes reversal, giving you opportunities to exit longs or enter shorts while everyone else is still convinced the rally will continue. That early positioning comes with trade-offs: lower reliability, smaller moves, more patience required, and more frequent stop-outs. But for traders willing to accept those limitations and trade accordingly, the bearish harami becomes a useful tool rather than a disappointing pattern that never seems to work as promised.
-
The pattern signals indecision and momentum exhaustion rather than aggressive reversal, requiring confirmation for reliable trading
-
Success rates between 50-65% mean this pattern fails regularly even when identified and traded correctly
-
The small second candle contained within the first reveals buying pressure has disappeared, creating vulnerability to reversal
-
Position sizing should be reduced compared to high-conviction patterns to account for higher failure rates
-
Best performance occurs at resistance levels, after extended rallies, and when combined with overbought technical indicators
-
The pattern appears early in reversal processes, producing smaller average moves than aggressive formations like Bearish Engulfing
-
Patience is required as price often consolidates after the pattern before actually reversing
Developing Pattern Recognition Through Practice
Getting good at spotting and trading the bearish harami happens the same way you develop any trading skill—repetition, feedback, and honest assessment of your results. Open your charts and scroll back through months or years of price history on stocks you follow. Mark every bearish harami you find, noting what happened in the 5-10 sessions afterward. You'll start seeing patterns within the pattern—certain contexts where it works better, conditions where it fails consistently, and nuances in candle size or volume that distinguish winners from losers. Then move to real-time identification.
Each day, scan your watchlist for formations developing right now. Make predictions without entering trades if you're not confident yet. Track whether your predictions were right and what you missed when they were wrong. This practice builds pattern recognition faster than passive reading because you're actively engaging with real market data and getting immediate feedback. Your early attempts will include false identifications and missed opportunities, which is exactly how learning works. The goal isn't perfection from the start—it's gradual improvement through consistent effort and willingness to acknowledge mistakes.
The Non-Negotiable Confirmation Rule
DO wait for the third candle to break below the pattern low before entering, sacrificing perfect entry for higher probability.
DO require supporting evidence from volume, technical indicators, or location at resistance before risking capital on this pattern.
DO accept that missing some trades because you waited for confirmation is better than taking losses on trades that never had confirmation.
DON'T enter immediately after the second candle forms just because the pattern technically exists on the chart.
DON'T convince yourself that "this time is different" and enter without confirmation because the setup looks particularly clean.
DON'T treat the bearish harami like stronger patterns that can be traded more aggressively—its nature demands more caution.
Final Thoughts on Trading This Pattern
The bearish harami will frustrate you if you approach it expecting the reliability and drama of more aggressive reversal patterns. But if you understand what it actually does—identifies momentum exhaustion early, before obvious reversal signals appear—and trade it accordingly with reduced position sizes, confirmation requirements, and patience for consolidation periods, it becomes a valuable addition to your pattern recognition toolkit. The pattern works best as one piece of evidence supporting a bearish thesis rather than the sole reason for taking a trade.
When you spot a bearish harami at resistance with overbought conditions and volume declining, and then wait for that third candle to confirm the breakdown, you're stacking probabilities in your favor. That's when this subtle pattern earns its place in your strategy despite its limitations. Master the bearish harami not by forcing it to be something it isn't, but by accepting what it is and using it appropriately.


