


Why Failed Breakouts Can Create Some Of The Best Trades
One of the most common frustrations we hear from newer traders is a tale as old as time. A level finally breaks, you jump in with conviction, and the market immediately reverses, stopping you out. And yet despite everyone experiencing it, it still feels like the market is hunting you personally. But what many traders don’t realize is that these false breaks, often called stop-hunts, can actually be some of the most reliable opportunities if you can change your thinking just a little bit.
Here’s the theory. When price pushes above resistance or dips below support, it often isn’t about a new trend beginning. Instead, it’s the market testing and clearing out liquidity. Stops are triggered, breakout traders pile in, and once that supply of orders is absorbed, price snaps back the other way. That failure to hold the breakout level is the real signal, and it’s where experienced traders step in.

Lamont calls this setup the pass back over. The name says it all. Price looks above (or below) an important level, fails to stay there, and passes back under (or over) the level. Rather than chasing the false move, experienced traders will fade it (counter trade it). Risk is defined just beyond the failed level, while potential reward often stretches much further, creating excellent asymmetry.
The key is context. A false break against the prevailing trend is rarely worth touching, but a failed move with the broader picture, say, a weak bounce in a downtrend, can be powerful. This is why traders always zoom out first to assess whether the daily and session context support a theory of failed breakout as a genuine opportunity or just noise.
It’s worth repeating: not every breakout fails, and not every failure should be faded. But when the market reveals that buyers (or sellers) couldn’t hold where they needed to, it’s a clue. That moment of weakness often provides some of the best entries you’ll find, because the math tilts heavily in your favor.
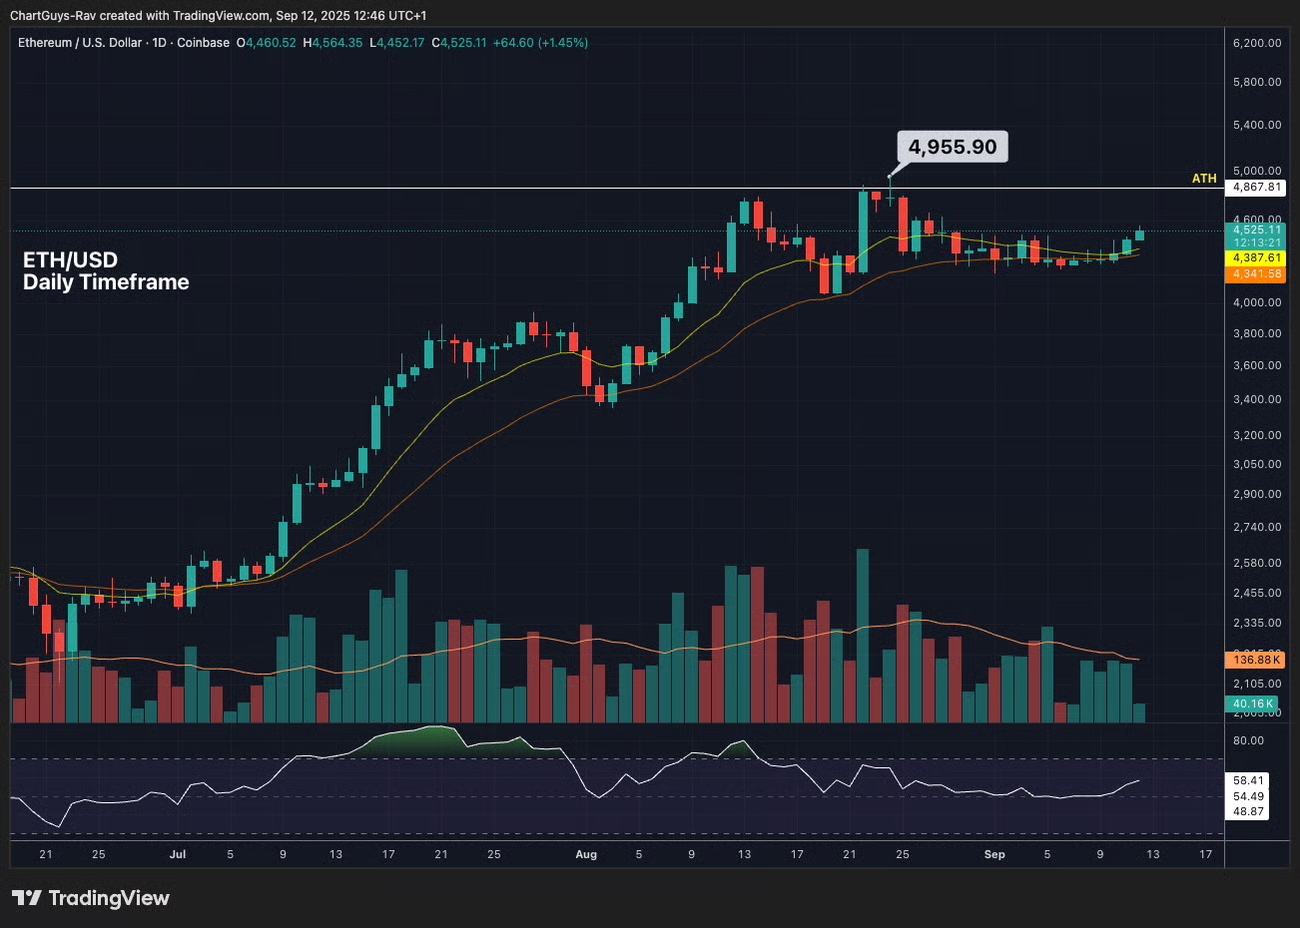
Here is a great example we can see in Ethereum just recently. Everyone was watching the break of the all-time-high level around $4,800, but we only popped to $4,955 then went straight into daily consolidation. Bitcoin was the same scenario at the level break of $123,240 on August 14.
Think of stop-hunts as the market’s stress test. If the breakout can’t stand up to pressure, it’s not the end of the world, it’s an opportunity to look the other way.
Lamont explains this concept in detail in his video, with chart examples that show exactly how to spot and trade these plays. It’s well worth a watch if you’ve ever felt “tricked” by a breakout.
