


Shooting Star vs Hammer: Understanding the Difference

Candlestick patterns can look deceptively similar while meaning completely different things. The hammer and shooting star are perfect examples—they're both single-candle formations with small bodies and long wicks, but one signals potential bullish reversal while the other warns of bearish reversal. The confusion is understandable, but costly if you mistake one for the other.
Why These Patterns Get Mixed Up
Both patterns share the same basic structure: a small real body and one long wick that's at least twice the length of the body. If you're scanning charts quickly, they look like mirror images of each other. And in a way, they are—but context flips the meaning entirely.
A hammer has a long lower wick with the body at the top, appearing after a downtrend to signal buyers are stepping in. A shooting star has a long upper wick with the body at the bottom, appearing after an uptrend to signal sellers are rejecting higher prices. Same visual structure, opposite locations, opposite implications.
The shooting star vs hammer comparison matters because traders who ignore context will misread these patterns constantly. You might see what looks like a hammer and get excited about a bullish reversal, only to realize later that it appeared at the top of a rally—that's actually a different pattern entirely, and it's bearish. Location determines everything.
The hammer and shooting star demonstrate a fundamental principle in technical analysis: the shape of a candle matters less than where it appears on the chart and what story it's telling about the battle between buyers and sellers.
Visual Structure: What Each Pattern Looks Like


Understanding the shooting star vs hammer debate starts with recognizing what each pattern actually looks like. Both have specific structural requirements—not every candle with a wick qualifies as either pattern.
Hammer Anatomy
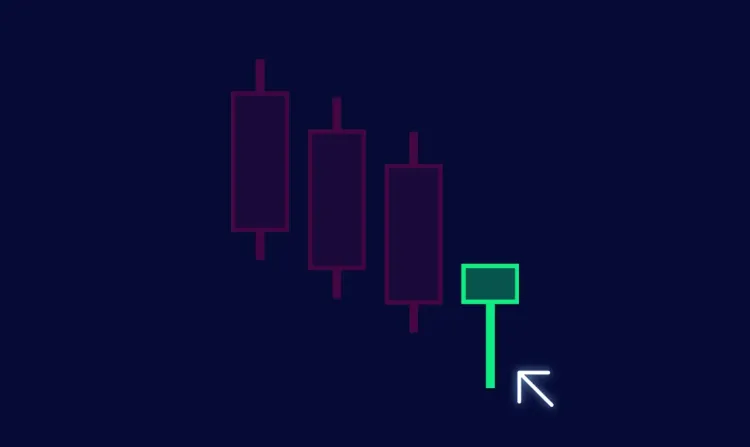
The hammer gets its name from the shape: a handle at the top with a heavy head hanging down. The pattern signals that sellers pushed prices lower during the session, but buyers rejected those lower prices and pushed back up by the close.
Structural requirements for a hammer:
-
Small real body: The distance between open and close is relatively small compared to the total candle range
-
Body at the top: The real body sits at or near the high of the candle
-
Long lower wick: The lower shadow extends at least twice the length of the real body, often more
-
Minimal or no upper wick: Little to no upper shadow—the close should be at or very near the session high
-
Body color flexible: Can be green (close above open) or red (close below open), though green is slightly preferred
-
Appears after decline: Must form after a downtrend or at support to qualify as a bullish hammer
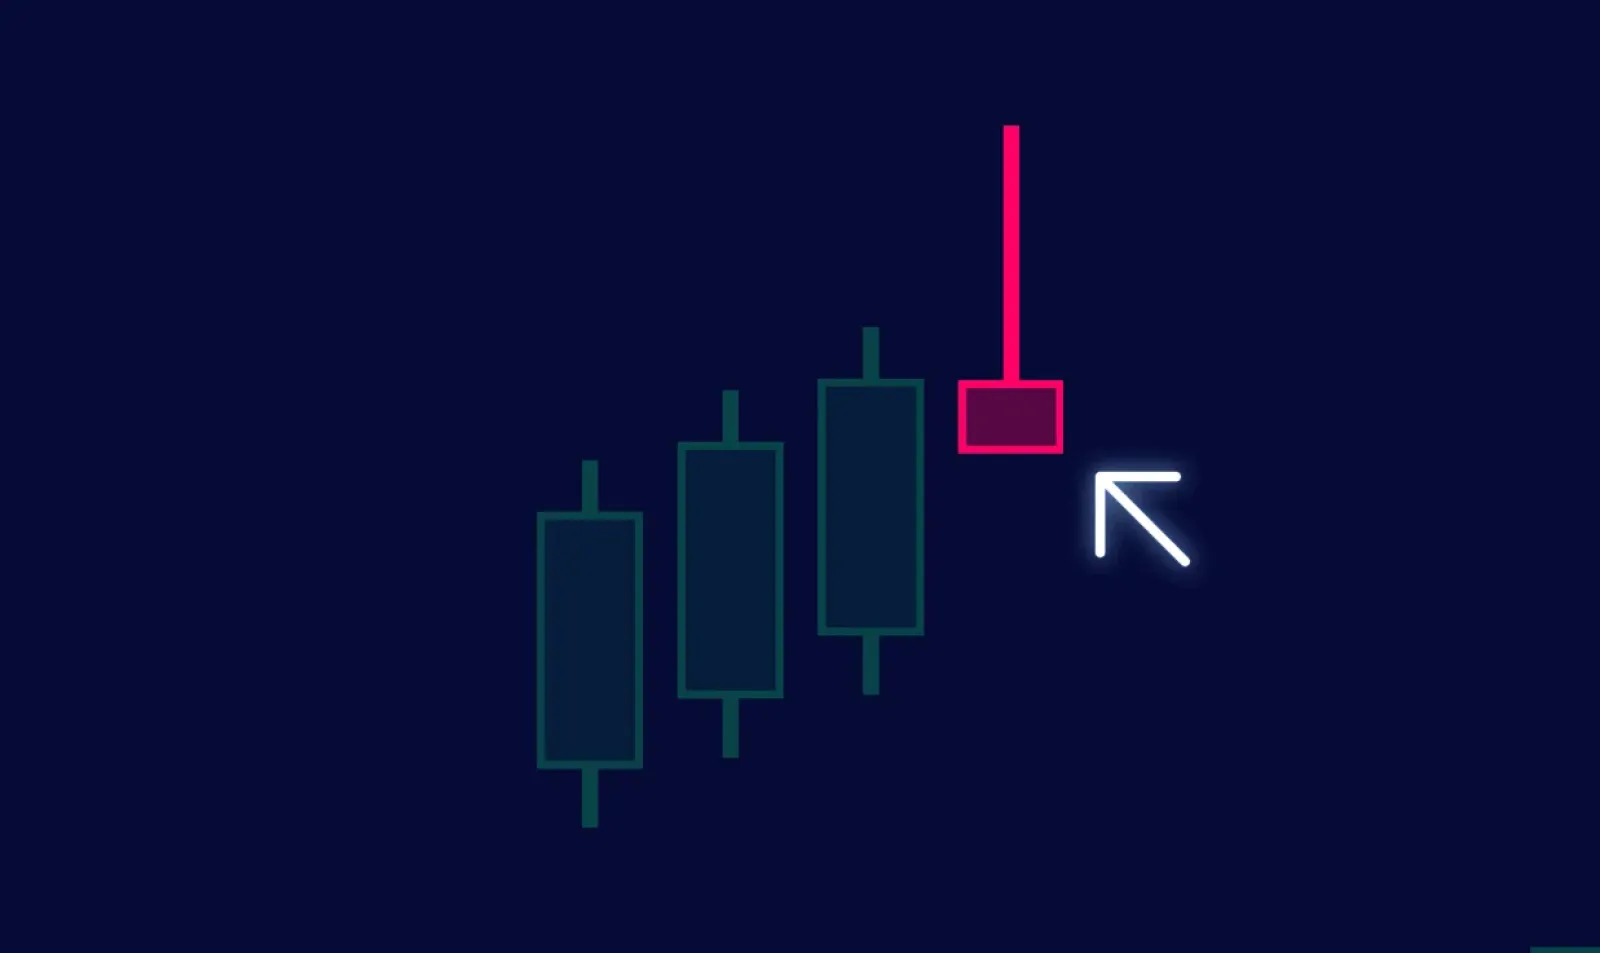
Shooting Star Anatomy
The shooting star looks like it shot upward and fell back down—buyers tried to push higher but failed. The pattern signals that buyers drove prices up during the session, but sellers rejected those higher prices and pushed back down by the close.
Structural requirements for a shooting star:
-
Small real body: The distance between open and close is small relative to the total range
-
Body at the bottom: The real body sits at or near the low of the candle
-
Long upper wick: The upper shadow extends at least twice the length of the real body
-
Minimal or no lower wick: Little to no lower shadow—the close should be at or very near the session low
-
Body color flexible: Can be red (close below open) or green (close above open), though red is slightly preferred
-
Appears after advance: Must form after an uptrend or at resistance to qualify as a bearish shooting star
The Mirror Image Relationship
If you flip a hammer upside down, you get a shooting star. If you flip a shooting star upside down, you get a hammer. They're structural opposites—one rejects lower prices, the other rejects higher prices.
The body color debate persists among traders. Purists prefer a green body for hammers (buyers closed above the open, showing strength) and red body for shooting stars (sellers closed below the open, showing weakness). In practice, the body color matters less than the wick structure and location. A red-bodied hammer after a downtrend still shows rejection of lower prices. A green-bodied shooting star after an uptrend still shows failure to hold higher prices.
The Bottom Line: Both patterns feature small bodies and long wicks, but the hammer's long lower wick shows buyers defending support while the shooting star's long upper wick shows sellers defending resistance—context and wick direction determine which pattern you're looking at and what it means.
The Psychology Behind Each Pattern


Candlestick patterns are records of human behavior during a trading session. The shooting star vs hammer comparison shows two opposite psychological stories—one about buyers gaining control, the other about sellers reasserting dominance.
What Happened During the Session
Hammer: The session opens and sellers immediately or eventually push prices significantly lower. For part of the day, it looks like the downtrend is continuing. Then buyers step in, rejecting those lower prices and pushing the stock back up. By the close, price has recovered most or all of the losses from earlier in the session. The long lower wick captures this rejection—sellers tried to go lower and failed.
Shooting Star: The session opens and buyers push prices significantly higher. For part of the day, it looks like the uptrend is accelerating. Then sellers step in, rejecting those higher prices and pushing the stock back down. By the close, price has given up most or all of the gains from earlier in the session. The long upper wick captures this rejection—buyers tried to go higher and failed.
What the Long Wick Actually Represents
The wick isn't just a line on a chart—it's a battlefield report. It shows where one side tried to push price and where the other side defended successfully.
What long wicks tell you:
-
Rejection of price level: The wick marks a price zone where the opposing force was strong enough to reverse the move
-
Intraday failure: One side controlled part of the session but couldn't hold that control through the close
-
Testing boundaries: The market tested a level (support for hammer, resistance for shooting star) and that level held
-
Shift in control: The long wick followed by a close near the opposite end shows momentum changing hands during the session
-
Failed momentum: What looked like continuation of the existing trend during the session proved unsustainable
Failed Breakout vs. Successful Defense
The difference between these patterns comes down to which side wins the session's battle and what that suggests about the trend.
IF sellers push a stock lower during the session but buyers drive it back up by the close… THEN you have a hammer showing buyers are defending support and may be ready to push higher.
IF that hammer appears after a downtrend at a known support level… THEN the rejection of lower prices suggests the downtrend may be exhausting and a reversal could follow.
IF buyers push a stock higher during the session but sellers drive it back down by the close… THEN you have a shooting star showing sellers are defending resistance and may be ready to push lower.
IF that shooting star appears after an uptrend at a known resistance level… THEN the rejection of higher prices suggests the uptrend may be exhausting and a reversal could follow.
IF the long wick is three or four times the size of the small body… THEN the rejection was emphatic—one side tried hard to move price and got decisively pushed back.
Location and Context Requirements

A candle's shape means nothing without context. The same visual pattern signals completely different things depending on where it appears on the chart. This is why the shooting star vs hammer distinction matters so much—they're not just visually different, they require opposite trend contexts to be valid.
Hammer Context: After Downtrends
The hammer only works as a bullish reversal signal when it appears after price has been declining. You're looking for the pattern at the bottom of a move, near support, or after a period of selling pressure.
Quick tip: The best hammer setups form after at least a 10-15% decline or several weeks of downward pressure—this ensures there's actually a downtrend to reverse.
Quick tip: Hammers that appear at prior lows, round numbers, or major moving averages carry more weight because they combine pattern recognition with known support zones.
Quick tip: If you see a hammer-shaped candle in the middle of an uptrend or at the top of a rally, it's not a hammer—it might be a hanging man, which is bearish.
Shooting Star Context: After Uptrends
The shooting star only works as a bearish reversal signal when it appears after price has been climbing. You're looking for the pattern at the top of a move, near resistance, or after a period of buying pressure.
Quick tip: The best shooting star setups form after at least a 10-15% advance or several weeks of upward pressure—this ensures there's actually an uptrend that might be exhausting.
Quick tip: Shooting stars that appear at prior highs, round numbers, or major moving averages carry more weight because they combine pattern recognition with known resistance zones.
Quick tip: If you see a shooting star-shaped candle in the middle of a downtrend or at the bottom of a decline, it's not a shooting star—it might be an inverted hammer, which is bullish.
Why Location Changes Everything
The same candle shape can be bullish or bearish depending entirely on where it appears. A long lower wick at the bottom of a downtrend (hammer) shows buyers stepping in to defend support. The exact same long lower wick at the top of an uptrend (hanging man) shows buyers losing momentum even though they managed to push back from lows.
Context tells you what the rejection means. When a hammer forms after a decline, the rejection of lower prices suggests sellers are losing control and buyers are finding a level to defend. When a shooting star forms after a rally, the rejection of higher prices suggests buyers are losing control and sellers are finding a level to defend.
Without proper trend context, you're just looking at random candles with wicks. A hammer in an uptrend isn't giving you a bullish signal—it's either irrelevant or potentially bearish. A shooting star in a downtrend isn't warning you of reversal—it's either noise or potentially bullish as an inverted hammer.
Trend context is non-negotiable for both patterns—ignore where the candle appears on the chart and you'll misread every signal, confusing bullish hammers with bearish hanging men and bearish shooting stars with bullish inverted hammers.
Confirmation Signals
Neither the hammer nor shooting star should be traded in isolation. Both patterns improve dramatically when backed by volume, confirmed by the following candle, and aligned with key support or resistance levels. Confirmation separates patterns worth trading from patterns worth ignoring.
Volume Characteristics for Hammers
Volume tells you whether the rejection of lower prices was meaningful or just light trading creating a visual pattern. Strong volume during a hammer formation suggests real buyers stepped in with conviction.
What to look for in hammer volume:
-
Above-average volume on the hammer candle itself—shows significant participation in the rejection
-
Volume spike at the low of the session—indicates buyers aggressively defended that price level
-
Higher volume than the preceding red candles—buyers showed up with more force than recent sellers
-
Declining volume during the downtrend leading to the hammer—suggests selling pressure was exhausting
-
Increasing volume on the confirmation candle—proves follow-through buying after the pattern
Volume Characteristics for Shooting Stars
Volume confirms whether the rejection of higher prices was backed by real selling or just profit-taking on light participation. Strong volume during a shooting star suggests sellers actively defended that level.
What to look for in shooting star volume:
-
Above-average volume on the shooting star candle—shows significant participation in the rejection
-
Volume spike at the high of the session—indicates sellers aggressively defended that price level
-
Higher volume than the preceding green candles—sellers showed up with more force than recent buyers
-
Declining volume during the uptrend leading to the shooting star—suggests buying pressure was weakening
-
Increasing volume on the confirmation candle—proves follow-through selling after the pattern
The Confirmation Candle Test
The candle immediately following the pattern determines whether the reversal signal has legitimacy. This is where many traders decide whether to enter or pass on the setup.
For hammers, you want the next candle to open at or above the hammer's close and continue higher, ideally closing above the hammer's high. This confirms buyers maintained control after the pattern formed. If the next candle gaps down or closes below the hammer's low, the pattern failed immediately.
For shooting stars, you want the next candle to open at or below the shooting star's close and continue lower, ideally closing below the shooting star's low. This confirms sellers maintained control after the pattern formed. If the next candle gaps up or closes above the shooting star's high, the pattern failed immediately.
Support and Resistance Context
Patterns gain strength when they align with other technical factors. The shooting star vs hammer decision becomes clearer when you check whether the pattern formed at a logical level where price should react.
Location matters for confirmation:
DO: Trust hammers that form at prior swing lows, round numbers, or major moving averages—these levels have historical significance
DO: Trust shooting stars that form at prior swing highs, round numbers, or major moving averages—these levels have acted as resistance before
DO: Look for multiple timeframe confirmation—the pattern works on the daily chart and aligns with a key level on the weekly chart
DO: Check if the pattern formed where you'd expect a reaction based on other technical analysis
DON'T: Trade hammers or shooting stars that form in the middle of nowhere without any support or resistance nearby
DON'T: Ignore failed patterns—if the confirmation candle doesn't follow through, the setup is broken
DON'T: Assume the pattern works just because it looks right—volume and confirmation are required
DON'T: Force the pattern—if you have to squint to see it or the context is ambiguous, it's probably not a valid setup
Trading the Hammer

Recognizing a hammer is one thing. Trading it profitably requires a plan for entry, stop placement, and targets. The pattern gives you a framework, but you need to make specific decisions about timing and risk before putting money on the line.
Entry strategies for hammer patterns:
-
Conservative entry: Wait for the confirmation candle to close above the hammer's high, then enter at the open of the following session—highest probability but you pay a higher price
-
Aggressive entry: Enter at the close of the hammer candle itself or on a limit order just above the hammer's high—better price but more risk of immediate failure
-
Pullback entry: Wait for confirmation, then enter on a slight pullback to the hammer's body level—requires patience but improves risk/reward
-
Breakout entry: Enter when price breaks above a resistance level near the hammer—combines pattern with breakout momentum
-
Scaling approach: Enter half position on confirmation, add the second half if price continues higher—reduces risk if the pattern fails early
Stop Loss Placement
Your stop should go below the hammer's low wick. That's the level buyers defended—if price falls back through it, the pattern failed and there's no reason to stay in the trade.
Pro tip: Place your stop 1-2% below the hammer's absolute low rather than right at it—this prevents getting stopped out by a quick wick that immediately reverses back up.
Pro tip: If the hammer's lower wick is extremely long (4-5 times the body size), consider using the midpoint of the wick as your stop to avoid risking too much capital on a single trade.
Pro tip: Tighten your stop to breakeven once price moves 1.5-2x your initial risk distance—this locks in protection while giving the trade room to develop.
Profit Targets and Market Conditions
Setting realistic targets based on the pattern and nearby resistance gives you a logical exit plan. You're not holding forever—you're capturing the reversal move the hammer suggested.
Target considerations:
-
Measured move: Project the height of the hammer's range (high to low) upward from the breakout point as a minimum target
-
Prior resistance: Identify the next significant resistance level above the hammer—former highs, round numbers, moving averages
-
Risk/reward ratio: Target at least 2:1 or 3:1 compared to your initial risk—if your stop is $1 away, target at least $2-3 away
-
Multiple targets: Scale out of half your position at the first resistance level, trail a stop on the remaining half
-
Time stops: If the trade hasn't reached your target within 5-10 sessions, consider exiting—the momentum may be stalling
The best market conditions for hammer trades include overall market in neutral or uptrend, the stock's sector showing relative strength, the pattern forming at a logical support level with volume confirmation, and RSI recovering from oversold territory during the hammer formation.
Remember: The hammer pattern works best when the broader market isn't fighting against you—trying to catch a bullish reversal in a stock while the overall market is in a strong downtrend significantly reduces your success rate regardless of how perfect the hammer looks.
Trading the Shooting Star

The shooting star signals potential bearish reversal, but trading it requires different considerations than the hammer. You're either shorting the stock or exiting long positions, both of which come with their own risk management requirements.
Entry strategies for shooting star patterns:
-
Conservative entry: Wait for the confirmation candle to close below the shooting star's low, then enter short at the open of the following session—highest probability
-
Aggressive short entry: Enter short at the close of the shooting star candle itself or on a limit order just below the shooting star's low—better price but higher risk
-
Resistance rejection entry: Enter short when price tests the shooting star's high and gets rejected again—adds confluence to the setup
-
Exit long strategy: If you're already long, use the shooting star as a signal to exit or tighten stops rather than flipping to short
-
Breakout fade entry: Enter short when price breaks below a support level near the shooting star—combines pattern with breakdown
Stop Loss Placement
Your stop should go above the shooting star's high wick. That's the level sellers defended—if price pushes back through it, the pattern failed and the bearish thesis is broken.
Stops on short positions are especially important because upside risk is theoretically unlimited while downside profit is limited to zero. The shooting star vs hammer comparison shows that while both patterns need stops, shooting star stops protect against potentially explosive moves against you.
Place your stop 1-2% above the shooting star's absolute high to avoid getting stopped out by a brief spike that reverses. If the upper wick is extremely long, consider the cost of that wide stop—it might force your position size smaller than makes sense for the trade.
Shorting vs. Exiting Longs
Not everyone can or should short stocks. Understanding your options when you see a shooting star helps you make the right decision for your situation.
Your choices with shooting star patterns:
-
Exit existing longs: If you're holding the stock, the shooting star is a warning to take profits or at least tighten your stop loss
-
Short the stock: If you have a margin account and understand short selling mechanics, the shooting star offers an entry point for bearish bets
-
Buy puts: Options traders can buy put options as a limited-risk way to profit from the expected decline
-
Wait it out: If you're long-term bullish and the shooting star appears on a daily chart, you might choose to hold through short-term weakness
-
Reduce position size: Cut your position in half to reduce exposure while keeping some upside if the pattern fails
Risk Management for Bearish Setups
Shorting stocks or trading bearish patterns carries different risks than going long. Markets tend to fall faster than they rise, but they also bounce harder.
DO: Size short positions smaller than long positions—20-50% of what you'd risk going long—because downside moves can be violent and reversals sharp
DO: Use the shooting star high as your absolute stop—no second chances if price reclaims that level
DO: Take profits faster on bearish trades—markets don't stay down as long as they stay up, so be ready to exit when you hit targets
DO: Check the broader market—shooting stars work better when the overall market is showing weakness or at least neutral
DON'T: Short into a strong bull market just because you see a shooting star—the pattern might be right but the market context can override it
DON'T: Hold bearish positions through earnings or major news events unless that's specifically part of your strategy
DON'T: Ignore your stop because "it has to go down eventually"—hope destroys short sellers faster than long buyers
DON'T: Over-leverage short positions—the risk of explosive moves against you is higher than most traders expect
Common Misidentifications


The shooting star vs hammer confusion is just the beginning. Several other candlestick patterns look similar to these two, and mixing them up leads to trading the wrong signals. Context and location determine which pattern you're actually looking at.
Patterns that get confused with hammer and shooting star:
-
Hanging man: Looks identical to a hammer (small body at top, long lower wick) but appears after an uptrend instead of a downtrend—actually bearish, not bullish
-
Inverted hammer: Looks identical to a shooting star (small body at bottom, long upper wick) but appears after a downtrend instead of an uptrend—actually bullish, not bearish
-
Dragonfly doji: Has a long lower wick like a hammer but no real body at all (open equals close)—can be bullish after downtrends but weaker signal
-
Gravestone doji: Has a long upper wick like a shooting star but no real body (open equals close)—can be bearish after uptrends but weaker signal
-
Spinning tops: Small bodies with wicks on both sides—shows indecision rather than clear rejection, less reliable than hammer or shooting star
-
High wave candles: Long wicks both directions with small body—extreme volatility and indecision, not a clear reversal signal
-
Pin bars: Forex term for candles with long wicks, can be hammer-like or shooting star-like depending on location and context
Why Location Is Everything
A candle with a long lower wick at the bottom of a downtrend is a hammer signaling bullish reversal. The exact same candle shape at the top of an uptrend is a hanging man signaling bearish reversal. The structure is identical—only the location changed.
A candle with a long upper wick at the top of an uptrend is a shooting star signaling bearish reversal. The exact same candle shape at the bottom of a downtrend is an inverted hammer signaling bullish reversal. Again, identical structure, opposite meaning based entirely on context.
This is why scanning charts for patterns without checking trend context leads to disaster. You'll spot what looks like a hammer and get excited about going long, only to realize it appeared at the top of a 30% rally and is actually a hanging man warning you to get out.
The doji variations add another layer of confusion because they lack real bodies entirely. A dragonfly doji after a downtrend acts similar to a hammer—buyers rejected lower prices and closed right at the open. A gravestone doji after an uptrend acts similar to a shooting star—sellers rejected higher prices and closed right at the open. But without the small body, these patterns are generally considered weaker signals.
The Bottom Line: The shooting star vs hammer distinction isn't just about wick direction—it's about understanding that candle structure alone means nothing without trend context, and several other patterns share similar shapes with completely different implications based solely on where they appear on the chart.
Reliability and Failure Rates


No candlestick pattern works every time. The hammer and shooting star are useful signals, but they fail often enough that you need realistic expectations about what these patterns can and cannot do. Understanding when they work best and when they're likely to fail keeps you from overrelying on them.
Conditions That Increase Success Rates
Both patterns improve dramatically when certain conditions align. These factors don't guarantee success, but they shift probability meaningfully in your favor.
What makes these patterns more reliable:
-
Strong volume confirmation: Above-average volume on the pattern candle and the confirmation candle shows real participation backing the reversal
-
Clear trend preceding the pattern: The hammer follows an obvious downtrend, the shooting star follows an obvious uptrend—no ambiguity about context
-
Key level alignment: Pattern forms at prior swing high/low, round number, or major moving average—adds technical confluence
-
Confirmation candle follow-through: The next candle continues in the expected direction without hesitation or reversal
-
Multiple timeframe agreement: Pattern appears on both daily and weekly charts, or the daily pattern aligns with weekly support/resistance
-
Market context support: Broader market environment isn't fighting against the individual stock's pattern
-
RSI alignment: Hammer forms while RSI climbs from oversold, shooting star forms while RSI falls from overbought
-
Pattern appears after extended move: The preceding trend has been strong and sustained, suggesting exhaustion is realistic
When These Patterns Fail Most Often
Certain conditions stack the deck against hammer and shooting star patterns. Recognizing these scenarios helps you avoid low-probability setups.
Common failure scenarios:
-
Low volume formation: The pattern forms on light trading—not enough participation to support a real reversal
-
Weak or unclear trend: The pattern appears during choppy, sideways action where there's no clear trend to reverse
-
No confirmation: The next candle immediately reverses the pattern's implication—hammer followed by sharp decline, shooting star followed by sharp rally
-
Pattern in isolation: No support/resistance nearby, no moving average confluence, no other technical reason to expect a reversal at that level
-
Counter-trend market: Trying to catch a bullish hammer while the overall market is selling off hard, or a bearish shooting star while the market is ripping higher
-
Exhaustion after exhaustion: Multiple failed reversal attempts have already occurred at this level—the pattern is just another false signal
-
News or earnings override: Fundamental developments trump the technical pattern—earnings announcement, sector news, or market-wide events
-
Extremely extended wicks: The wick is so long that even a reversal doesn't get you to a reasonable profit target before hitting the next obstacle
Managing Expectations
Single-candle reversal patterns are probabilistic signals, not certainties. Even in ideal conditions with confirmation and volume, the shooting star vs hammer patterns fail 30-40% of the time. That's why position sizing, stop losses, and risk management matter more than pattern recognition.
The patterns work because they capture a shift in the balance between buyers and sellers at a turning point. But markets don't always turn when you expect them to. Sometimes the hammer forms, gets confirmed, moves higher for two days, then rolls over and continues the downtrend. Sometimes the shooting star appears, gets confirmed, drops for a day, then gaps up and continues the uptrend.
Your edge comes from taking multiple pattern trades over time with proper risk management, not from assuming any individual pattern will definitely work. Win rate matters less than whether your winners are bigger than your losers and whether you're cutting losses quickly when patterns fail.
Combining with Other Technical Analysis
The hammer or shooting star pattern by itself is just one data point. When you layer additional technical factors on top of the pattern, you build a stronger case for the trade. Confluence—multiple indicators agreeing—is what separates high-probability setups from coin flips.
Technical factors that strengthen hammer and shooting star patterns:
-
Moving average alignment: Hammer forms at the 50-day or 200-day moving average, or shooting star forms after price extended far above key moving averages
-
RSI confirmation: RSI climbing from oversold (below 30) during hammer formation, or RSI falling from overbought (above 70) during shooting star formation
-
MACD signals: MACD crossing bullish during or after hammer, or MACD crossing bearish during or after shooting star
-
Volume profile gaps: Pattern forms in a low-volume zone between two high-volume areas, giving room to move
-
Support/resistance zones: Hammer at prior swing low or major support, shooting star at prior swing high or major resistance
-
Fibonacci levels: Pattern aligns with 50% or 61.8% retracement level from the prior move
-
Round numbers: Pattern forms at psychologically significant levels like $50, $100, $150
-
Trendline interaction: Hammer bounces off ascending trendline, shooting star rejects descending trendline
-
Bollinger Band extremes: Hammer at lower band after downtrend, shooting star at upper band after uptrend
-
Prior price action: Pattern forms where reversals have occurred before—same level that's worked historically
Building the Case
The more factors that align, the higher your confidence should be in the setup. A hammer that forms at the 200-day moving average, with RSI at 28, on volume 2x the daily average, at a prior swing low—that's a different animal than a random hammer in the middle of nowhere.
Pro tip: Create a checklist of confluence factors and require at least three to align before taking the trade—pattern plus two additional technical factors minimum.
Pro tip: Weight your position sizes based on confluence—when four or five factors align perfectly, you can size slightly larger within your risk parameters; when only two factors align, size smaller or pass entirely.
DO: Use multiple timeframes to verify confluence—check that the daily pattern aligns with weekly support or resistance
DO: Prioritize patterns that form where you'd expect a reaction even without the candlestick pattern
DON'T: Trade the pattern just because it looks textbook perfect if nothing else supports it
DON'T: Ignore obvious resistance overhead for hammers or obvious support underneath for shooting stars just because the pattern formed
When evaluating the shooting star vs hammer decision and whether to trade either pattern, ask yourself how many independent reasons you have to expect a reversal at that exact spot—if the candlestick pattern is your only reason, you're probably forcing a trade that doesn't have enough probability behind it.
Using Shooting Star vs Hammer Patterns Effectively

Single-candle patterns like the hammer and shooting star are useful tools, but they're not complete trading systems. They highlight potential turning points and give you a visual way to spot when buyers or sellers are defending a level. That's valuable information, but it's the beginning of your analysis, not the end.
The patterns work best when they're part of a broader technical picture. You see a hammer at support with volume confirmation and RSI recovering from oversold territory—that's a story you can act on. You see a shooting star at resistance after an extended rally with declining volume and momentum divergence—that's a warning worth heeding. But the patterns alone, without context or confirmation, are just shapes on a chart.
Pattern Recognition as a Developing Skill
Learning to identify hammers and shooting stars is quick. Learning when to trade them and when to ignore them takes longer. You'll spot patterns constantly once you know what to look for, but most of them won't be worth trading. The skill is in filtering.
Early on, every hammer looks like a buying opportunity and every shooting star looks like a shorting setup. With experience, you start seeing the ones that form in terrible locations, on weak volume, without confirmation, or against the broader market trend. You learn to let those go. The shooting star vs hammer debate becomes less about identifying the shape and more about evaluating whether the context supports acting on what you're seeing.
Pattern recognition isn't about memorizing candle formations—it's about understanding what those formations tell you about the balance between buyers and sellers, and whether that information is actionable given everything else happening on the chart and in the market.
The hammer and shooting star patterns give you entry points and warnings, but confirmation, volume, location, and market context determine whether those signals are worth your capital—pattern recognition is a skill that develops through seeing which setups work and learning why the others fail.


