


What Makes the Diamond Pattern Special


Most candlestick and chart patterns show up regularly enough that you'll see multiple examples every week if you scan enough stocks. The diamond pattern is different—you might go months without spotting a legitimate formation. That rarity is part of what makes it significant when it does appear, though it also means most traders never get comfortable trading it.
Why the diamond pattern remains rare and often missed:
-
Complex two-phase structure requires both expanding and contracting volatility in sequence
-
Takes weeks or months to fully form, making real-time identification difficult
-
Looks incomplete or like other patterns during formation, leading traders to misidentify it
-
Appears only during genuine trend exhaustion, which doesn't happen as often as traders think
-
Requires significant price movement and volatility to create the distinct diamond shape
-
Many formations that start as potential diamonds never complete properly
The Complexity Problem
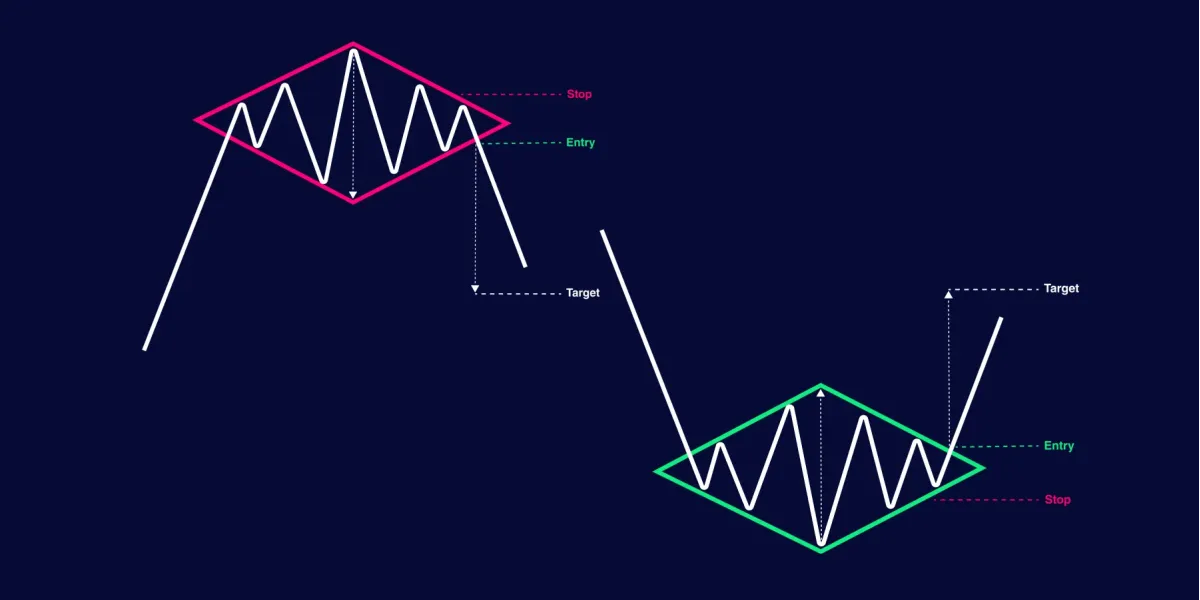
The diamond pattern forms through two distinct phases. First, price action expands outward with widening swings—higher highs and lower lows creating diverging trendlines. Then the volatility contracts with narrowing swings—the highs stop going higher and the lows stop going lower, creating converging trendlines that meet the first phase to form a diamond shape.
This two-phase requirement filters out most price action that looks vaguely diamond-like. A simple triangle only has one phase of convergence. A broadening formation only has the expanding phase without the contraction. The diamond needs both, in sequence, which is what makes it so uncommon and so challenging to spot as it develops.
Diamond Top vs. Diamond Bottom
Diamond Top: Forms after an uptrend and signals bearish reversal. The expanding phase shows bulls and bears battling with increasing volatility near the top of the move. The contracting phase shows bulls losing steam and volatility declining. When price breaks below the lower support line of the diamond, the pattern completes bearishly.
Diamond Bottom: Forms after a downtrend and signals bullish reversal. The expanding phase shows intense selling followed by counter-rallies creating wider swings near the bottom. The contracting phase shows bears losing control and volatility compressing. When price breaks above the upper resistance line of the diamond, the pattern completes bullishly.
Key Difference: Diamond bottoms are even rarer than diamond tops. Bottoms form during panic and capitulation where volatility spikes violently, but sustained two-phase diamond formations at bottoms are uncommon. Tops tend to form more gradually with the rolling volatility expansion and contraction that creates cleaner diamond shapes.
Recognition in Technical Analysis
The diamond pattern has been documented in technical analysis literature since the early days of chart pattern recognition, but it never achieved the mainstream recognition of head and shoulders or flags. Its rarity meant fewer examples to study, and its complexity meant fewer traders could reliably identify it.
Classic technical analysts valued the pattern for its reliability when properly formed—the two-phase structure genuinely represents a shift in market psychology from trending behavior to exhaustion and reversal. Modern traders often overlook it because algorithmic pattern scanners struggle with the subjective nature of fitting trendlines to the expanding and contracting phases.
The diamond pattern earns its status as a significant formation not because it appears often or is easy to trade, but because when it does form properly and breaks out with confirmation, it tends to produce sustained moves that reward the patience required to wait for such rare setups.
Anatomy of the Diamond Pattern


The diamond pattern gets its name from the shape created when you connect the highs and lows with trendlines. Understanding how this shape forms requires breaking it down into its two distinct phases that occur in sequence.
Expanding Phase: Price creates higher highs and lower lows, with volatility increasing. Draw trendlines connecting these expanding swing points—the upper trendline slopes upward, the lower trendline slopes downward, creating diverging lines that move apart from each other.
Contracting Phase: After reaching maximum width, price begins making lower highs and higher lows. The swings compress. New trendlines connecting these points converge—the upper trendline slopes downward, the lower trendline slopes upward, moving toward each other. Where these converging lines meet the expanding lines, you get the four corners of the diamond.
Creating the Diamond Shape
When both phases complete and you connect all the swing points, the result is a four-sided formation that resembles a diamond lying on its side. The left point is where the pattern begins, the widest part is where expansion shifts to contraction, and the right point is where the converging trendlines meet—this apex is where the breakout typically occurs.
Visual characteristics of a complete diamond:
-
Four distinct trendlines creating the diamond outline
-
Left point marks the beginning of volatility expansion
-
Top and bottom points mark maximum price range during the pattern
-
Right point (apex) marks maximum compression before breakout
-
Relatively symmetrical appearance, though perfect symmetry isn't required
-
Clear two-phase structure visible when you step back from the chart
Timeframe Considerations
The diamond pattern works best on timeframes where each candle represents significant price discovery. You need enough time for both the expansion and contraction phases to develop properly.
Daily charts are the most common timeframe for spotting legitimate diamond patterns. The formation typically takes 6-12 weeks to complete, though some extend longer. Weekly charts can show larger diamond formations that develop over several months—these are extremely rare but powerful when they appear.
Shorter timeframes like 4-hour or 1-hour charts occasionally show diamond-like structures, but these are less reliable. The pattern needs time to represent genuine shifts in volatility and trend exhaustion rather than intraday noise. Intraday diamonds exist but require more skepticism and confirmation before trading.
Minimum Requirements for Pattern Validity
Not every expanding-then-contracting price movement qualifies as a diamond pattern. The formation needs to meet specific criteria to be considered tradeable.
Requirements for a valid diamond:
-
At least four clear swing points (two highs, two lows) defining the diamond's boundaries
-
Distinct expanding phase showing increasing volatility with widening price range
-
Clear transition to contracting phase showing decreasing volatility with narrowing range
-
Both phases should be roughly similar in duration—not one quick phase and one extended phase
-
Pattern width should be at least 10-15% of the stock's price to be meaningful
-
Appears after a clearly established trend (uptrend for tops, downtrend for bottoms)
-
Takes minimum of 3-4 weeks to form—anything faster is probably noise or a different pattern
-
Clear breakout point at the apex or near the apex where trendlines converge
The Psychology Behind Diamond Formations


The diamond pattern captures a specific psychological progression in the market—from trending conviction to expanding uncertainty to eventual resolution. Each phase tells you something about what buyers and sellers are thinking and how that collective sentiment is shifting.
What's happening psychologically during diamond formation:
-
Initial expansion phase: The prior trend starts losing momentum, creating larger swings as disagreement grows between those who think the trend continues and those who think it's ending
-
Increasing volatility: Bulls and bears fight harder, pushing prices to new extremes in both directions—neither side has clear control yet
-
Maximum uncertainty: At the widest point of the diamond, sentiment is most divided—some participants are increasingly confident while others are increasingly worried
-
Transition to contraction: One side begins losing conviction, swings become less extreme, neither bulls nor bears can push price as far as before
-
Decreasing volatility: The battle loses intensity as participants realize the trend is exhausted—volume often declines during contraction phase
-
Resolution at apex: One side finally establishes control and price breaks out, often with renewed volume as the market makes a clear directional decision
-
Genuine exhaustion signal: The two-phase structure represents a true shift in market psychology, not just a brief pause or consolidation
Volume Tells the Story
Volume behavior during the diamond pattern provides confirmation that what you're seeing is genuine exhaustion rather than meaningless chop. Understanding the volume arc helps you distinguish between valid diamonds and random volatility.
During the expanding phase, volume typically increases along with the widening price swings. This makes sense—more participants are getting involved as the battle between bulls and bears intensifies. You see higher volume on both the rallies and the declines as conviction strengthens on both sides.
As the pattern transitions to the contracting phase, volume usually begins to decline. The narrowing price range and decreasing volume together signal that the trend exhaustion is progressing—neither side can muster the same enthusiasm they had earlier. This declining volume during contraction is normal and expected.
The breakout from the diamond pattern should ideally occur on expanding volume again. When price breaks through one of the trendlines at the apex, you want to see participation increase, confirming that the market has made a decision and one side is now clearly in control.
Reading the Phases
The two-phase structure of the diamond pattern gives you insight into how market psychology evolves from trending to reversal.
IF you see price making increasingly wide swings after a strong uptrend… THEN uncertainty is growing about whether the rally can continue—bulls are still pushing but bears are fighting back harder.
IF those swings then begin to narrow with lower highs and higher lows… THEN both sides are losing conviction—the trend exhaustion is becoming reality as neither can maintain the intensity.
IF volume declines during the contraction phase… THEN participants are stepping back, waiting for clarity before committing capital in either direction.
IF price breaks below the lower trendline of a diamond top on increasing volume… THEN bears have won the battle and participants who were uncertain are now selling, confirming the reversal.
IF price breaks above the upper trendline of a diamond bottom on increasing volume… THEN bulls have taken control and participants who were waiting are now buying, confirming the reversal.
Diamond Top Pattern
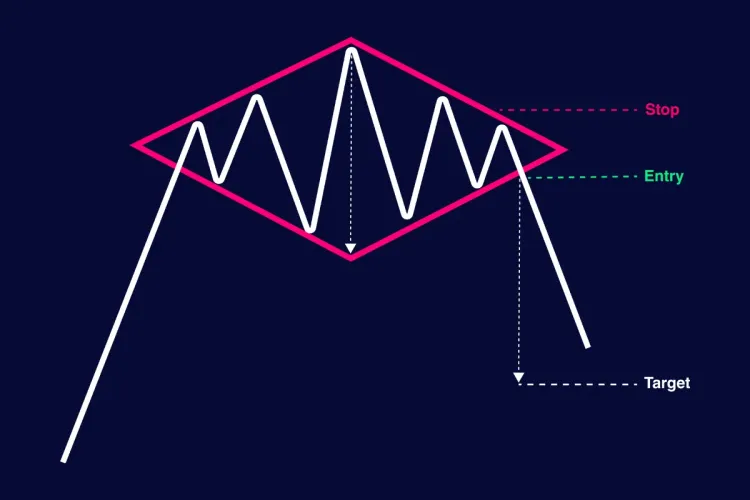

The diamond top forms at the end of an uptrend when buyers lose their ability to push prices consistently higher. What starts as normal profit-taking evolves into expanding volatility as bulls and bears battle over whether the rally can continue. Eventually the swings narrow, volatility compresses, and the pattern resolves with a breakdown that signals the uptrend is over.
Structure and Characteristics
The diamond top appears after a sustained uptrend, usually following a strong rally that's been in place for weeks or months. The pattern represents the final stage of bullish momentum before reversal.
Key features of diamond tops:
-
Forms after clear uptrend with stock trading near recent highs
-
Expanding phase shows increasingly wild swings—new highs followed by deeper pullbacks
-
Volume often increases during expansion as both buyers and sellers become more aggressive
-
Contraction phase shows narrowing range with lower highs and higher lows
-
Volume typically declines during contraction as uncertainty leads to lower participation
-
Breakout occurs when price closes decisively below the lower support trendline
-
Measuring target: take the pattern's height (high point to low point) and project that distance downward from the breakdown point
-
Retests of the broken support are common—former support becomes resistance
-
Best diamonds show clean two-phase structure taking 6-10 weeks minimum to develop
Trading Diamond Tops
Real-world identification of diamond tops is harder than it looks in textbooks. During formation, the pattern often looks like it could be a head and shoulders, a broadening top, or just choppy consolidation. You typically only get confirmation after the breakdown occurs.
DO: Wait for a clear breakdown below the lower trendline with a decisive close, not just a quick wick
DO: Look for volume expansion on the breakdown to confirm selling pressure is real
DON'T: Try to short the pattern before it breaks—price can still rally within the diamond structure
DON'T: Chase the breakdown if it's already moved 50-75% toward the measured target without you
Diamond Bottom Pattern
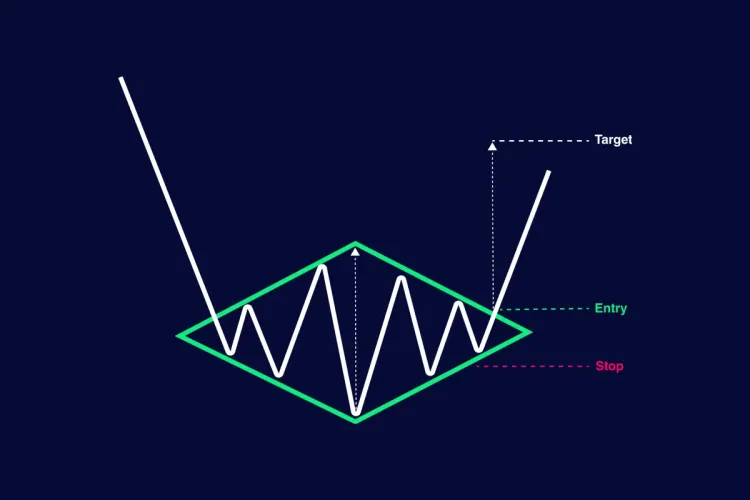
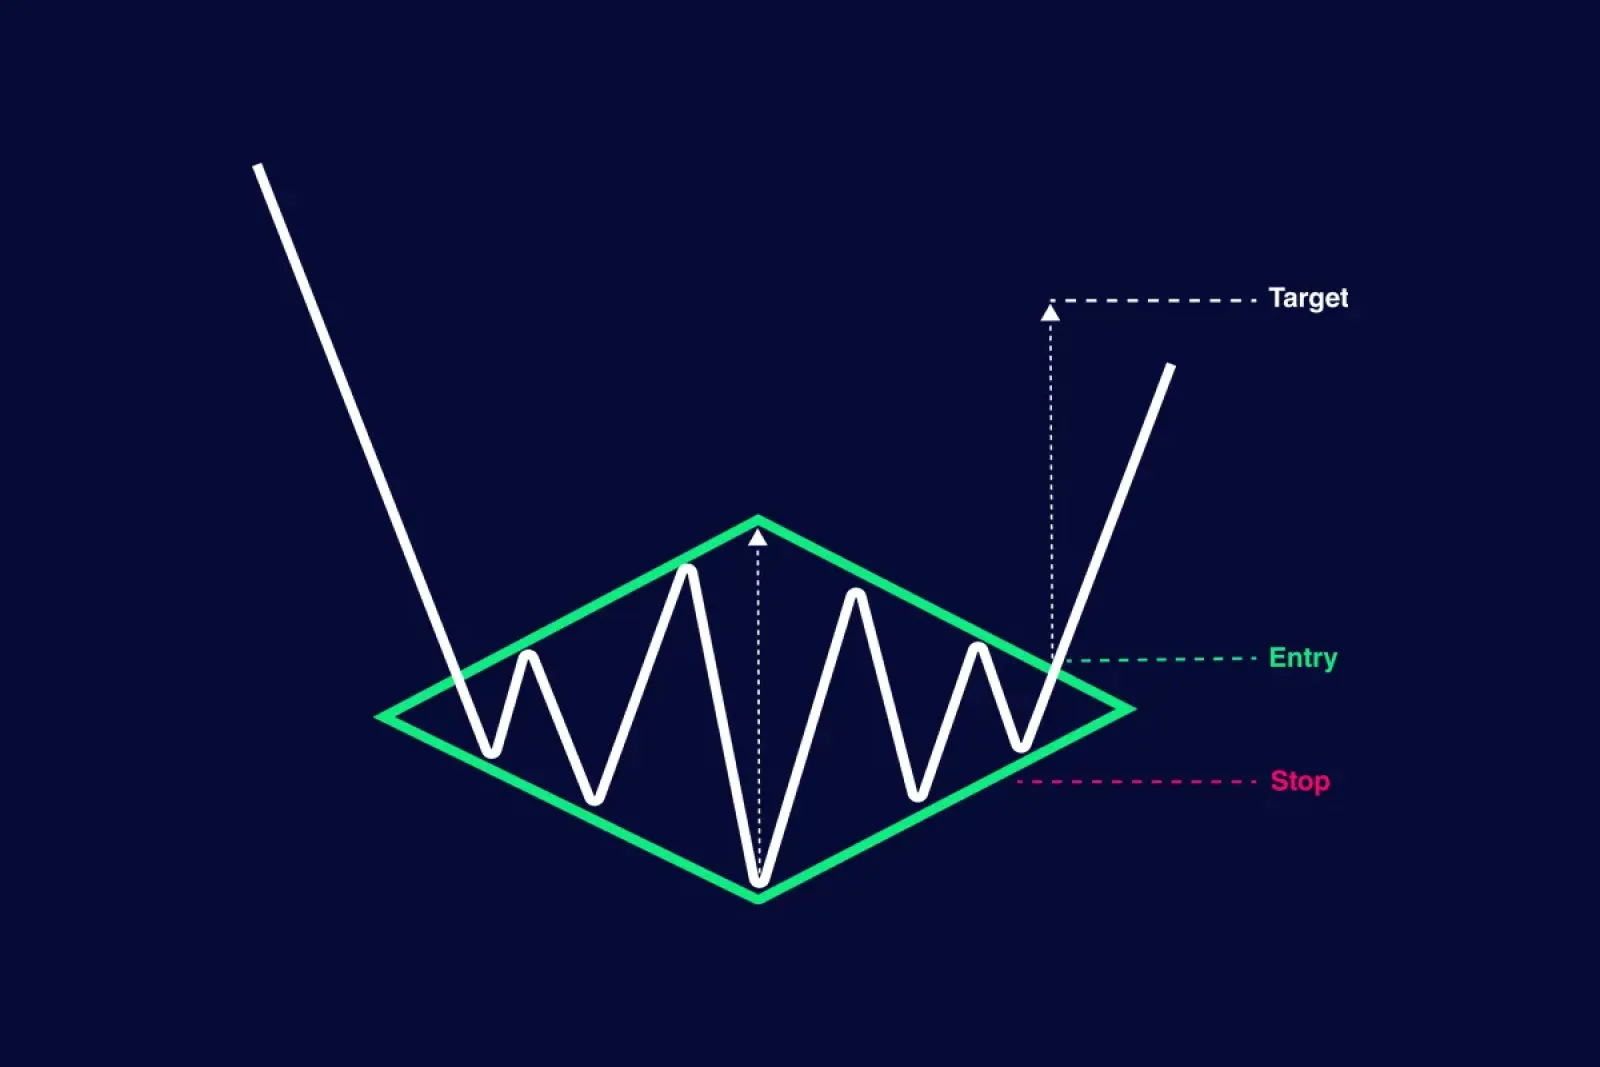
The diamond bottom forms at the end of a downtrend when sellers exhaust themselves and buyers begin testing whether the decline is over. Volatility expands as bears make new lows but bulls mount increasingly strong counter-rallies. The swings eventually narrow, and when price breaks above the upper resistance line, it signals the downtrend has reversed.
Structure and Characteristics
Diamond bottoms are significantly rarer than diamond tops. Markets tend to fall quickly with sharp volatility spikes, making the clean two-phase diamond structure harder to develop. When they do form properly, they're powerful reversal signals.
Key features of diamond bottoms:
-
Forms after sustained downtrend with stock trading near recent lows
-
Expanding phase shows violent swings—panic selling to new lows followed by sharp relief rallies
-
Volume spikes during the expanding phase, especially on down days as capitulation occurs
-
Contraction phase shows narrowing range with higher lows and lower highs
-
Volume declines during contraction as both selling pressure and buying interest moderate
-
Breakout occurs when price closes decisively above the upper resistance trendline
-
Measuring target: take the pattern's height (high point to low point) and project that distance upward from the breakout point
-
Retests of the broken resistance are common—former resistance becomes support
-
Rarity stems from bottoms forming quickly with V-shaped reversals rather than extended two-phase patterns
Trading Diamond Bottoms
Diamond bottoms are harder to spot than tops because downtrends end more abruptly. By the time you identify the two-phase structure, the pattern may already be breaking out. This scarcity makes each genuine diamond bottom worth paying attention to when it appears.
DO: Wait for breakout above the upper trendline with strong volume before entering long positions
DO: Watch for a retest of the breakout level as an entry opportunity with tighter risk
DON'T: Try to pick the bottom by buying during the expanding phase—let the pattern complete first
DON'T: Confuse a diamond bottom with a descending triangle or other single-phase patterns
Identifying the Pattern in Real Time


Spotting a diamond pattern as it forms is significantly harder than identifying one in hindsight on a completed chart. During the expansion phase, it could be a broadening formation. During contraction, it might look like a triangle. Only when both phases complete can you confirm what you're actually looking at.
Challenges during real-time identification:
-
Pattern looks like other formations until both phases complete
-
Expansion phase resembles broadening wedge or megaphone pattern
-
Contraction phase looks like symmetrical triangle or pennant
-
Head and shoulders patterns can have similar swing structures during formation
-
No way to know if expansion will lead to contraction or just continue widening
-
Takes weeks to develop, making it easy to lose focus or misidentify midway through
-
Many patterns that start as potential diamonds never complete the second phase
Distinguishing from Similar Patterns
The diamond pattern shares characteristics with several other formations, which is why traders frequently misidentify it or abandon recognition too early. The key differentiator is the two-phase structure—expansion followed by contraction.
A broadening formation only has the expanding phase without subsequent contraction. A triangle only has the contracting phase without prior expansion. Head and shoulders has three peaks but doesn't create the diamond outline with diverging and converging trendlines. The diamond needs both phases in sequence to qualify.
When to Abandon Recognition
Sometimes what looks like a developing diamond pattern never completes. Knowing when to stop waiting for completion prevents you from forcing a pattern that isn't there.
Signs the diamond pattern isn't forming:
-
Expansion phase extends for 8+ weeks without any sign of contraction beginning
-
Price breaks out of the expanding trendlines before contraction starts
-
Only one or two clear swing points instead of the minimum four needed for diamond shape
-
Contraction phase begins but immediately breaks out without forming the apex
-
Pattern develops on light volume without the volatility spikes diamonds typically show
-
Price action becomes so choppy that drawing meaningful trendlines is impossible
The Bottom Line: You'll often only confirm you're looking at a legitimate diamond pattern after it breaks out—trying to trade it before completion means you're guessing, and most potential diamonds never finish forming properly anyway.
Trading the Diamond Pattern


The diamond pattern's rarity and complexity demand patience. Most traders fail with this pattern by entering too early, before the breakout confirms the formation. Waiting for clear resolution through one of the trendlines significantly improves your success rate, even if it means getting a slightly worse entry price.
Entry Strategies
Timing your entry on diamond pattern trades comes down to whether you prioritize confirmation or price. Both approaches work depending on your risk tolerance and conviction in the setup.
Entry options for diamond trades:
-
Breakout entry: Enter when price closes decisively through the trendline (top or bottom) with above-average volume—highest probability but you pay up for confirmation
-
Retest entry: Wait for price to break out, then pull back to test the broken trendline before continuing—better price but not all breakouts retest
-
Apex entry: Enter right at the apex where trendlines converge if price is clearly moving through one side—aggressive but can catch the move early
-
Confirmation candle: Wait for the candle after the breakout to confirm direction before entering—reduces false breakout risk
-
Volume spike entry: Enter when breakout is accompanied by volume 2-3x the daily average—shows strong conviction behind the move
Stop Loss Placement
Diamond patterns are wide formations, which means your stops need room but also need to be logical. The key is using the pattern structure to define your risk.
Stop loss strategies:
-
Opposite trendline stop: For breakdown trades, place stop above the upper trendline; for breakout trades, place stop below the lower trendline
-
Apex stop: Place stop just beyond the apex point where trendlines meet—tighter risk but more likely to get hit
-
Pattern invalidation stop: Set stop at a level that would completely negate the pattern—if a diamond top breaks back above the high, it failed
-
Percentage-based stop: Use 5-7% stop from entry if the pattern is too wide for comfortable risk
-
Time stop: Exit if the trade hasn't moved toward target within 1-2 weeks after entry—momentum may be stalling
Profit Targets and Position Sizing
The measuring technique for diamond patterns uses the formation's height to project potential moves. This gives you a logical target based on the pattern's structure rather than guessing.
Take the vertical distance from the highest point to the lowest point within the diamond. That measurement becomes your projected move from the breakout point. For diamond tops, measure downward from the breakdown. For diamond bottoms, measure upward from the breakout.
Position sizing for the diamond pattern deserves special consideration because of its rarity. When a legitimate diamond forms with proper structure, volume confirmation, and clear breakout, it represents a higher-conviction setup than most patterns you'll encounter. You might size these trades slightly larger within your risk management rules—perhaps risking 2% instead of your typical 1%—while still respecting your stop loss placement.
Pro tip: Scale out of half your position at 50-60% of the measured target, then trail a stop on the remainder—diamond patterns sometimes exceed their targets but taking partial profits protects against reversals.
Pro tip: Don't force larger position sizes just because the pattern is rare—if the stop distance is too wide, accept a smaller share count rather than overriding your risk management for a "special" setup.
Confirmation Requirements


A diamond pattern that looks perfect on the chart can still fail if it lacks proper confirmation. Volume, price action after the breakout, and supporting technical factors determine whether the pattern is worth trading or just an interesting shape that won't follow through.
Volume Throughout the Pattern
Volume behavior during diamond formation tells you whether the psychological progression is real or just random price movement creating a diamond-like shape.
What to look for in volume:
-
Increasing volume during the expanding phase as volatility and uncertainty grow
-
Volume spikes on both rallies and declines during expansion showing active participation from both sides
-
Declining volume during the contracting phase as the battle loses intensity
-
Breakout volume should exceed average daily volume by at least 50-100%
-
Sustained higher volume for 2-3 days after breakout confirms the move has legs
-
Low volume breakouts are suspect and more likely to fail or reverse quickly
Price Action After Breakout
The first few days after the diamond pattern breaks out determine whether you have a legitimate signal or a false break that immediately reverses.
DO: Look for strong directional movement after the breakout—not just a slight break followed by drift back into the pattern
DO: Watch for clean price action without excessive wicks back into the pattern range—confident breakouts don't second-guess themselves
DON'T: Trust breakouts that immediately pull back inside the diamond and close within the pattern boundaries
DON'T: Ignore failed breakouts—if price breaks one direction then quickly reverses through the opposite trendline, the pattern failed
Multiple Timeframe and Indicator Confirmation
The diamond pattern gains strength when other technical factors align. Single-pattern trading without supporting evidence reduces your edge.
Check the weekly chart to see if the diamond aligns with a larger support or resistance level. If the daily diamond top is breaking down right at weekly resistance, that's confluence. Look at RSI to confirm momentum—diamond tops should show RSI declining from overbought levels, diamond bottoms should show RSI recovering from oversold. MACD crossing in the direction of the breakout adds confirmation that momentum is shifting to support the reversal signal.
Common Mistakes and Failures


The diamond pattern's rarity makes traders eager to find it, which leads to forcing patterns that don't actually exist or trading incomplete formations. These mistakes turn what should be a high-probability setup into a losing proposition.
Mistakes that undermine diamond pattern trades:
-
Pattern forcing: Drawing trendlines creatively to make random volatility look like a diamond when the two-phase structure isn't clearly present
-
Premature entry: Jumping in during the contraction phase before breakout occurs because you're convinced the diamond will resolve your predicted direction
-
Ignoring rarity: Treating diamonds as common patterns and taking every vague formation instead of waiting for textbook examples
-
Low volume acceptance: Trading diamonds that form on consistently below-average volume without the participation needed for legitimate reversals
-
Undersized patterns: Trading tiny diamonds that span only 5-7% price range—these lack the significance to drive sustained moves
-
Market context blindness: Trading a bearish diamond top while the overall market is in a strong uptrend, or bullish diamond bottom during market collapse
-
Incomplete formations: Entering when only the expanding phase has formed, hoping contraction will follow—most don't complete
-
No stop discipline: Holding through pattern failures because you believe in the setup, ignoring that price action has invalidated it
-
Overcomplicating simple patterns: Seeing diamonds where simpler patterns like triangles or rectangles better explain the price action
-
Confirmation avoidance: Entering on the breakout candle itself without waiting to see if it closes decisively through the trendline
Why These Failures Happen
The diamond pattern's complexity and infrequency create psychological pressure to find it even when it's not there. After learning about the pattern, traders start seeing potential diamonds everywhere. A stock makes a few wide swings and suddenly you're drawing trendlines trying to force a diamond shape.
The reality is that most price action that vaguely resembles a diamond is just volatility without the clean two-phase progression the pattern requires. Real diamonds are obvious in hindsight precisely because both phases develop clearly with proper structure. If you're squinting or adjusting your trendlines repeatedly to make the diamond work, it's probably not a diamond.
Remember: The diamond pattern's power comes from its rarity and the genuine trend exhaustion it represents—trying to trade every loose diamond-shaped formation dilutes your edge and turns a statistically advantageous pattern into a coin flip.
Making the Diamond Pattern Work for You


The diamond pattern's rarity makes it interesting but doesn't automatically make it more reliable than common patterns. A perfectly formed diamond with all the right characteristics can still fail if the broader market context works against it or if the breakout lacks volume confirmation. Rarity creates scarcity value in collectibles, not necessarily in trading signals.
Pattern Recognition vs. Reality
Learning about the diamond pattern often leads to a phase where you start seeing potential diamonds everywhere. That's normal—your brain is learning to recognize the structure. The skill comes in distinguishing between actual diamonds with clean two-phase progression and random volatility that creates vaguely diamond-shaped price action.
Most formations that look like they might become diamonds never complete. The expanding phase develops but never transitions to contraction. Or the contraction begins but breaks out prematurely without forming the full diamond shape. Building patience means watching many potential diamonds fail to materialize before you find one worth trading. That patience is what separates traders who use the pattern effectively from those who force trades on incomplete formations and wonder why their results don't match the textbook examples.
The diamond pattern works best as one element in broader technical analysis, not as a standalone signal. When a legitimate diamond forms at a key support or resistance level, with volume confirmation, RSI alignment, and favorable market context, you have a high-conviction setup. But the pattern alone, without supporting factors, is just an interesting shape that may or may not lead to a profitable trade.


