


Understanding the Morning Star Pattern


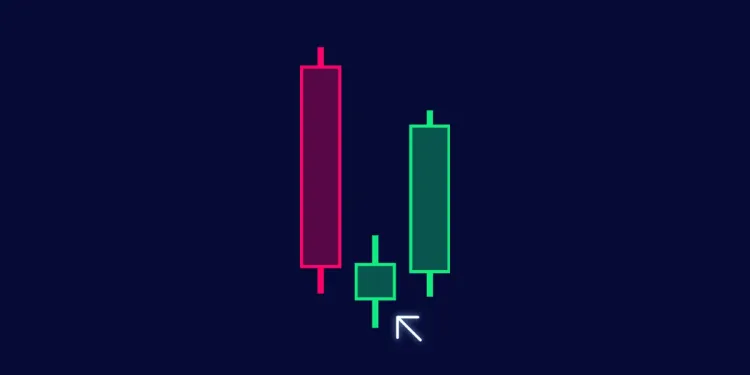
The morning star pattern is a three-candle formation that appears at the bottom of downtrends, signaling potential bullish reversal. It gets its name from the morning star—Venus—which appears before sunrise and heralds the coming of light. In trading terms, the pattern suggests darkness (the downtrend) is ending and a new uptrend may be beginning.
What the Pattern Actually Is
The morning star pattern consists of three distinct candles that tell a story of shifting control from sellers to buyers. Each candle plays a specific role in the reversal signal.
The three-candle structure:
-
First candle: Large bearish (red) candle showing sellers are still in control and the downtrend continues
-
Second candle: Small-bodied candle (can be red or green) that gaps down from the first candle, showing momentum is stalling
-
Third candle: Large bullish (green) candle that gaps up and closes well into the first candle's body, confirming buyers have taken control
Where It Appears and What It Signals
The morning star pattern only works as a bullish reversal signal when it appears in specific contexts. Location determines whether the pattern is valid or just three random candles.
Pattern requirements and signals:
-
Appears after a clear downtrend—minimum several days or weeks of declining prices
-
Forms near support levels, prior lows, or key technical zones where reversals are likely
-
Signals potential trend reversal from bearish to bullish as buyers step in to defend support
-
Most reliable when the second candle gaps down from the first and the third candle gaps up from the second
-
Works on multiple timeframes but most commonly traded on daily charts
-
Volume should ideally increase on the third candle, confirming buying pressure
The morning star pattern captures the transition from selling dominance to buying control across three trading sessions—sellers push prices lower, momentum stalls as uncertainty emerges, then buyers step in with enough force to suggest the downtrend may be over.
Anatomy of the Morning Star Pattern

Breaking down the morning star pattern candle by candle shows you what to look for when scanning charts. Each candle has specific characteristics that determine whether you're looking at a valid pattern or just three candles that happen to be next to each other.
The three candles in detail:
-
First candle (bearish continuation): Large red candle with a substantial real body, showing strong selling pressure—this candle continues the existing downtrend and closes near its low with minimal upper wick
-
Second candle (indecision): Small-bodied candle that can be red or green, ideally gaps down from the first candle's close—the small body shows neither buyers nor sellers have clear control, momentum is stalling
-
Third candle (bullish confirmation): Large green candle with substantial real body that ideally gaps up from the second candle—must close at least halfway into the first candle's body, preferably higher, showing buyers have decisively taken control
-
Body size contrast: The first and third candles should be roughly similar in size and significantly larger than the second candle—this contrast emphasizes the shift from selling to buying
-
Wick characteristics: The first candle should have minimal upper wick, the third candle should have minimal lower wick—this shows conviction on both the selling and buying days
Gap Requirements and Variations
The textbook morning star includes gaps between all three candles—the second candle gaps down from the first, and the third candle gaps up from the second. In practice, these gaps aren't always present, but patterns with clear gaps are stronger signals.
IF the second candle gaps down significantly from the first candle's close… THEN it shows selling pressure was so strong at the open that price jumped lower, making the subsequent reversal more meaningful.
IF the third candle gaps up from the second candle… THEN it demonstrates buyers came in aggressively at the open, not waiting for lower prices.
IF there are no gaps but the candle structure is otherwise correct… THEN the pattern is still valid but slightly weaker—confirmation through volume and the third candle's strength becomes more important.
IF the second candle is extremely small (nearly a doji)... THEN the indecision is even more pronounced, which can strengthen the pattern as it shows maximum uncertainty before the reversal.
IF the third candle closes above the first candle's open… THEN you have an exceptionally strong morning star—buyers not only reversed the trend but pushed price beyond where it started.
Body Size Relationships
The relationship between the three candle bodies matters as much as their individual characteristics. A morning star pattern with three similar-sized bodies doesn't send the same signal as one where the middle candle is dramatically smaller than the outer two.
The ideal morning star has large first and third candles with a tiny middle candle—this creates a visual "V" shape that's easy to spot. The small middle candle is the turning point, representing the moment when selling exhausts itself and buying emerges. If all three candles are roughly the same size, you lose that clear inflection point and the pattern becomes less reliable.
The Psychology Behind the Pattern

The morning star pattern tells a three-day story about changing market sentiment. Each candle represents a shift in the balance between buyers and sellers, and understanding what's happening psychologically helps you recognize when the pattern is genuine versus when it's just noise.
Day One: Sellers Still in Control
The first candle is a strong red candle that continues the existing downtrend. Sellers are confident, buyers are scared or absent, and the stock closes near its lows for the day. This is business as usual in a downtrend—no surprises, no signs of reversal, just continued selling pressure. Anyone who was hoping for a bottom is disappointed as the decline continues with conviction.
Day Two: Momentum Stalls, Uncertainty Emerges
The second candle opens with a gap down, suggesting sellers are still aggressive. But then something changes—the stock doesn't continue falling dramatically. Instead, it trades in a tight range with a small body. Neither buyers nor sellers can push price decisively in their direction. This indecision is the inflection point. Sellers who were dominant can't maintain momentum. Buyers aren't fully committed yet, but they're showing up enough to prevent further collapse. The small body captures this uncertainty—the market is questioning whether the downtrend still has legs.
Day Three: Buyers Take Over Decisively
The third candle opens higher, often with a gap up, and then continues climbing throughout the session. Buyers are now in control, pushing price significantly higher and closing well into the first candle's body. This isn't a tentative bounce—it's a strong reversal day that negates much of the selling from day one. The large green candle shows conviction. Traders who were waiting for confirmation that the downtrend is over now have it, and more buyers pile in, creating follow-through momentum.
What the Transition Reveals
The three-day progression from selling dominance to indecision to buying control represents a genuine shift in market sentiment, not just a random fluctuation.
What the pattern tells you about psychology:
-
Sellers exhaust themselves by day two—they pushed hard on day one but couldn't maintain pressure
-
The gap down on day two that doesn't follow through suggests panic selling met buyers willing to defend that level
-
The small second candle shows both sides losing conviction temporarily, creating a moment of balance
-
The gap up and strong close on day three proves buyers aren't just stabilizing price—they're reversing it
-
The pattern captures capitulation (day one), indecision (day two), and reversal (day three) in sequence
Why Three Candles Matter
One strong green candle after a downtrend could just be a dead cat bounce. Two candles might show some buying interest but lack confirmation. Three candles with this specific structure—selling, stalling, buying—create a more reliable signal because the progression is clear.
Quick tip: The morning star pattern works best when day two's indecision candle is tiny compared to days one and three—this extreme contrast shows the momentum shift was dramatic, not gradual.
Quick tip: Pay attention to where the third candle closes relative to the first candle's body—closing halfway up is minimum, but closing at or above the first candle's open is much stronger confirmation.
The Bottom Line: The morning star pattern captures a three-session shift from sellers in control, to neither side dominating, to buyers taking over—this progression is what makes it more reliable than single-candle reversal patterns that lack the same narrative structure.
Morning Star vs. Evening Star
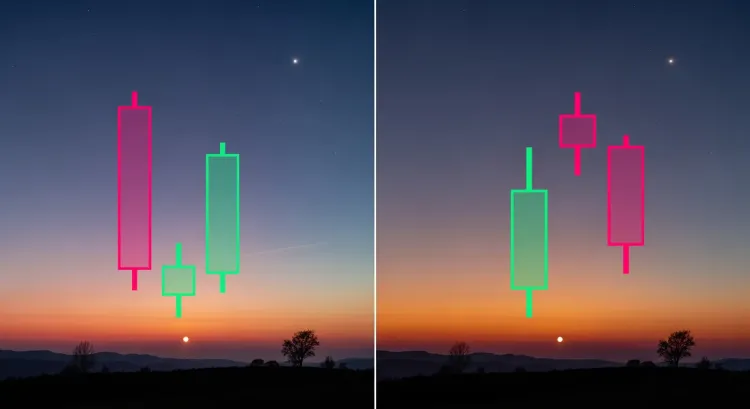
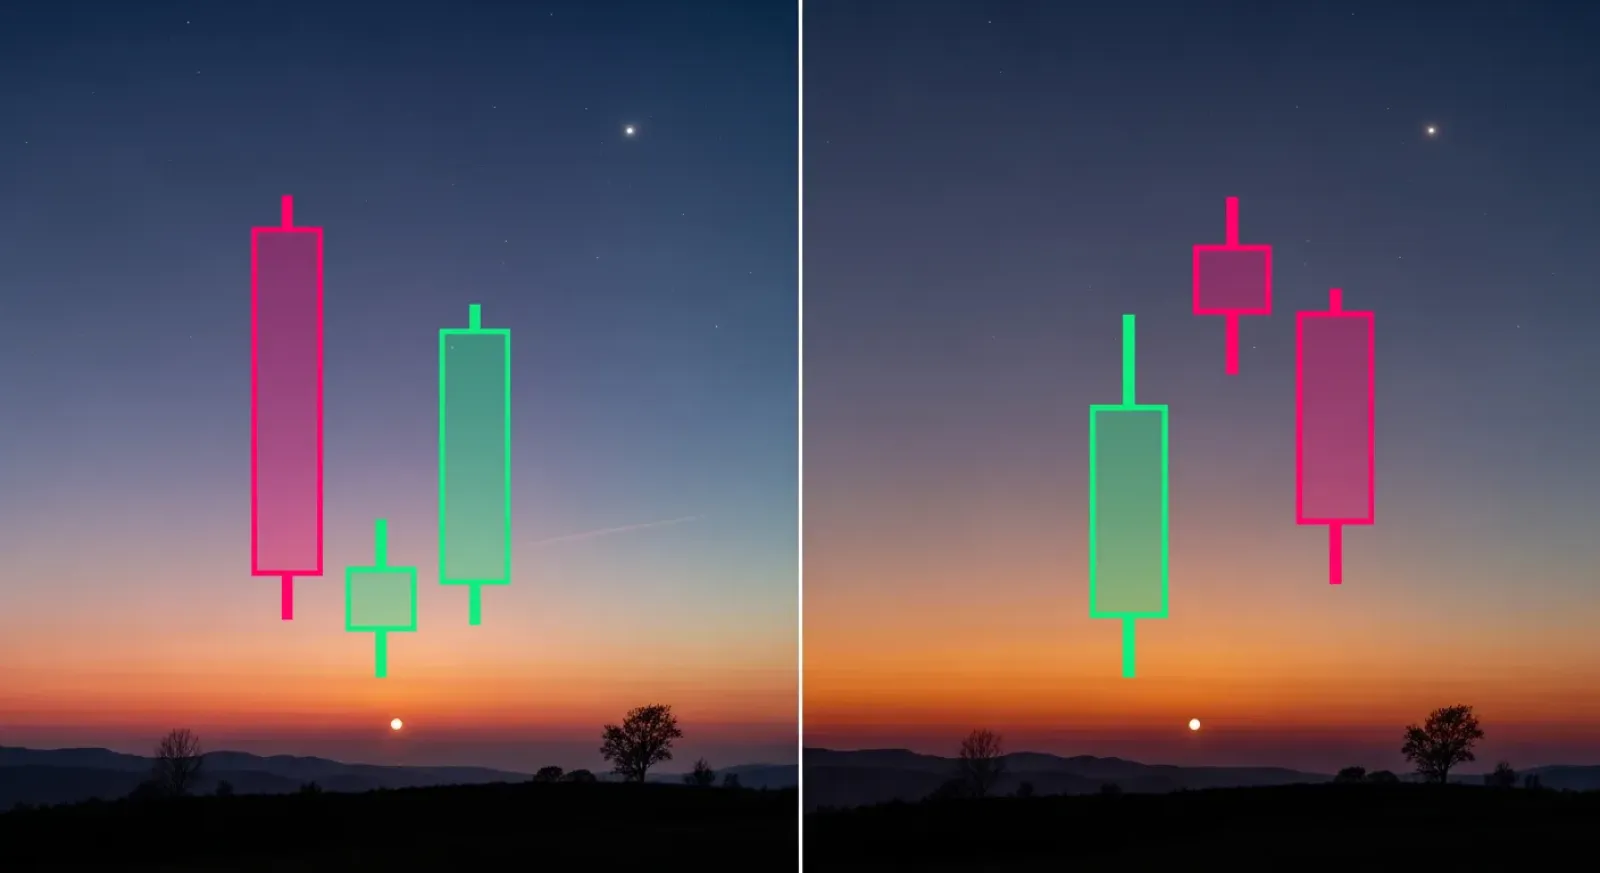
The morning star and evening star are mirror images of each other, appearing at opposite ends of trends with opposite implications. Understanding both patterns helps you avoid confusing a bullish signal for a bearish one, which happens more often than you'd think when traders ignore context.
The Evening Star as Bearish Opposite
The evening star appears after uptrends and signals potential bearish reversal. It has the same three-candle structure as the morning star but inverted—and it requires the opposite trend context.
Evening star structure:
-
First candle: Large green candle continuing the uptrend, showing buyers still in control
-
Second candle: Small-bodied candle that gaps up from the first, showing momentum stalling at the top
-
Third candle: Large red candle that gaps down and closes well into the first candle's body, confirming sellers have taken control
-
Location: Must appear after an uptrend near resistance levels or prior highs
-
Signal: Warns that the uptrend may be exhausting and reversal to the downside is possible
-
Psychology: Buying exhaustion (day one), indecision at the peak (day two), selling takeover (day three)
Avoiding Confusion
The candle structure can look similar during formation, but trend context tells you which pattern you're actually looking at.
DO: Check the trend before the pattern—morning stars need downtrends, evening stars need uptrends
DO: Look at where price is relative to recent action—morning stars at support zones, evening stars at resistance zones
DO: Consider the broader market context—is this a likely spot for reversal based on other technical factors
DON'T: Call it a morning star just because you see three candles with that shape without checking the preceding trend
DON'T: Ignore the trend and trade both patterns the same way—they require opposite positions
DON'T: Assume a pattern is bullish or bearish based solely on candle colors without checking location
Why Location Changes Everything
The same three-candle sequence means completely different things depending on where it appears on the chart. This is the most common mistake traders make with these patterns.
Location determines the pattern:
-
Three-candle sequence with large red, small body, large green after a downtrend = morning star (bullish)
-
Same sequence after an uptrend at resistance = not a morning star, possibly a failed pattern or noise
-
Three-candle sequence with large green, small body, large red after an uptrend = evening star (bearish)
-
Same sequence after a downtrend at support = not an evening star, possibly a failed pattern or noise
-
Pattern appearing in the middle of choppy sideways action = neither pattern, just volatility without trend context
Remember: The morning star pattern and evening star pattern are defined as much by where they appear as by their candle structure—trying to trade them without proper trend context turns a high-probability reversal signal into a random gamble.
Ideal Conditions for Morning Star Patterns


Not every morning star deserves a trade. The pattern gains strength when specific conditions align—proper trend context, key support levels, volume confirmation, and favorable market environment. These factors separate high-probability setups from mediocre ones that are likely to fail.
Conditions that strengthen the morning star:
-
Clear downtrend preceding the pattern, minimum 10-15% decline or several weeks of lower lows
-
Pattern forms at known support level—prior swing low, round number, or major moving average
-
Volume declines during the downtrend leading up to the pattern, suggesting selling pressure is exhausting
-
Volume increases significantly on the third candle, confirming buying pressure is real
-
Gaps present between all three candles—second gaps down from first, third gaps up from second
-
Third candle closes at least halfway into the first candle's body, ideally higher
-
RSI is oversold (below 30) when the pattern forms, showing the stock was stretched to the downside
-
Broader market is neutral or bullish—not fighting against overall market weakness
Support Level Confluence
The morning star pattern becomes dramatically more reliable when it forms at a price level where you'd expect buyers to defend even without the candlestick pattern. This is confluence—multiple technical factors agreeing.
If a stock has bounced from $45 three times in the past year, and a morning star forms right at $45 again, you have both pattern recognition and historical support backing the setup. That's stronger than a morning star appearing at $52 where there's no technical significance to that price level. The support zone gives buyers a logical reason to step in, and the morning star confirms they're actually doing it.
The same logic applies to moving averages. A morning star forming right at the 200-day moving average combines the pattern with a widely-watched technical level. Institutional algorithms and human traders both pay attention to major moving averages, so patterns that form at these levels get more participation and follow-through.
Gap Requirements
The textbook morning star includes gaps on both sides of the middle candle. In reality, you'll see variations where one or both gaps are missing.
Pro tip: Patterns with both gaps are stronger because the gaps show conviction—sellers were aggressive enough to gap price down, then buyers were aggressive enough to gap it back up, demonstrating clear shifts in control.
Pro tip: If gaps are absent but the candle structure is otherwise perfect and volume confirms, the pattern can still work—just require more supporting factors like support confluence or RSI oversold before taking the trade.
Market Context Validation
The broader market environment affects whether individual stock patterns follow through. Even perfect morning star patterns struggle when the overall market is collapsing.
Market conditions that validate morning star setups:
-
S&P 500 is in neutral or uptrend, not in strong downtrend fighting against your bullish signal
-
Stock's sector is showing relative strength or at least not leading the market lower
-
No major negative catalyst pending—earnings in two days can override technical patterns
-
Market volatility (VIX) is elevated but not extreme panic levels—some fear creates better reversal opportunities
-
Pattern forms during normal trading hours with normal volume, not during thin holiday trading
The morning star pattern works best when it appears at the intersection of multiple technical factors—downtrend exhaustion, support level defense, volume confirmation, and favorable market context—rather than in isolation where it's just three candles without supporting evidence.
Confirmation Requirements

The morning star pattern isn't complete just because you see three candles in the right order. Confirmation through the third candle's close, volume behavior, follow-through, and supporting technical factors determines whether the pattern is worth trading or just an interesting shape that won't lead anywhere.
What constitutes proper confirmation:
-
Third candle closes at least 50% into the first candle's body—the deeper the penetration, the stronger the signal
-
Volume on the third candle exceeds the average daily volume, ideally by 50-100% or more
-
Fourth candle continues higher or consolidates without breaking below the pattern's low
-
RSI is recovering from oversold territory (below 30) during pattern formation
-
Stock is trading near or above a key support level—prior low, round number, or major moving average
-
MACD shows bullish divergence or crosses above its signal line during the pattern
-
Pattern appears on daily chart and aligns with weekly chart support or structure
-
No major resistance level sits immediately above the pattern blocking potential upside movement
The Fourth Candle Test
What happens immediately after the morning star completes tells you whether the reversal signal has legs. This is where many traders make their entry decision rather than jumping in during the pattern itself.
IF the fourth candle opens higher and continues the rally from the third candle… THEN the pattern has strong follow-through and buyers remain in control—high probability entry signal.
IF the fourth candle consolidates near the third candle's close without falling back into the pattern… THEN buyers are holding gains but not aggressively pushing higher yet—still valid, consider entering on confirmation of continuation.
IF the fourth candle gaps up significantly… THEN the reversal is accelerating and you may have missed the ideal entry, but the pattern confirmation is very strong.
IF the fourth candle reverses and closes below the second candle's low… THEN the pattern failed immediately and the reversal signal was false—do not enter or exit if already in.
IF the fourth candle shows indecision with a small body and long wicks… THEN the market is unsure whether to continue the reversal—wait for additional confirmation before entering.
IF volume on the fourth candle remains elevated or increases further… THEN participation is growing and the move has momentum—adds confidence to the setup.
The morning star pattern gains credibility when the third candle's close penetrates deep into the first candle, volume confirms buying pressure, the fourth candle validates the reversal, and other technical indicators align—without these confirmation factors, you're trading on hope rather than probability.
Trading the Morning Star


Recognizing the morning star pattern is one thing—trading it profitably requires specific decisions about entry timing, risk management, and targets. You need a plan for when to enter, where to place your stop, and where to take profits before you risk capital.
Entry strategies for morning star patterns:
-
Conservative entry: Wait for the fourth candle to confirm continuation by closing higher than the third candle—highest probability but you pay a higher price
-
Aggressive entry: Enter at the close of the third candle or on a limit order just above it—better price but more risk of immediate failure
-
Breakout entry: Wait for price to break above a nearby resistance level after the pattern forms—combines pattern with breakout momentum
-
Pullback entry: Enter if price pulls back to the top of the pattern (around the third candle's close) after initially moving higher—requires patience but improves risk/reward
-
Scaling approach: Enter half position on pattern completion, add second half if the fourth candle confirms—reduces risk if pattern fails immediately
Stop Loss Placement
Your stop should go below the pattern's lowest point. That's typically the low of the second candle, which represents the level buyers defended. If price falls back through it, the reversal failed and there's no reason to hold.
Tip: Place your stop 1-2% below the pattern low rather than exactly at it—this prevents getting stopped out by a quick wick that immediately reverses back up.
Tip: If the pattern's range is very large (more than 8-10% from entry to stop), consider passing on the trade or using a smaller position size to maintain proper risk management.
Tip: Once price moves 1.5-2x your initial risk in your favor, consider moving your stop to breakeven to protect against giving back gains.
Profit Targets and Position Sizing
Setting realistic targets based on the chart structure gives you a logical exit plan rather than hoping price goes up indefinitely.
Target considerations:
-
Prior resistance: Identify the next significant resistance level above the pattern—prior swing high, round number, or moving average
-
Measured move: Some traders project the height of the downtrend that preceded the pattern as the potential reversal distance
-
Risk/reward minimum: Target at least 2:1 or 3:1 compared to your initial risk—if your stop is $1 away, target at least $2-3 away
-
Multiple targets: Scale out of half your position at the first resistance level, trail a stop on the remaining half
-
Timeframe consideration: Daily chart patterns typically need 1-3 weeks to reach targets—if it hasn't moved within that window, consider exiting
Conservative vs. Aggressive Approaches
Your trading style and risk tolerance determine which approach makes sense for you when trading the morning star pattern.
Conservative traders wait for the fourth candle to confirm, require above-average volume on the third candle, insist on gaps between candles, and only take patterns that form at clear support levels with RSI oversold. They get fewer trades but higher win rates because they're selective and patient.
Aggressive traders enter on the close of the third candle, accept patterns without perfect gaps if the structure is otherwise solid, and are willing to trade patterns in the middle of trends rather than only at major support. They get more trades but need tighter risk management because some will fail that a conservative trader would have filtered out.
Neither approach is wrong—it's about matching your strategy to your personality and capital. Conservative works better for smaller accounts that can't afford many losses. Aggressive works for experienced traders who can handle more frequent losses in exchange for catching moves earlier.
Variations and Related Patterns

The morning star has several variations and related patterns that share similar characteristics but differ in specific details. Understanding these helps you recognize reversal signals even when they don't match the textbook morning star perfectly.
Related patterns and variations:
-
Morning star doji: The second candle is a doji (open equals close) instead of a small-bodied candle—shows even more extreme indecision at the turning point, potentially stronger signal
-
Abandoned baby: Rare variation where the second candle gaps away from both the first and third candles with no overlap—extremely strong reversal signal when it appears
-
Piercing pattern: Two-candle bullish reversal where a large red candle is followed by a large green candle that opens below the first candle's low but closes above its midpoint—compressed version of morning star
-
Bullish engulfing: Two-candle pattern where the second green candle completely engulfs the first red candle's body—similar psychology but faster transition
-
Three white soldiers: Three consecutive large green candles after a downtrend—shows sustained buying rather than the pause/reversal structure of morning star
-
Hammer followed by bullish candle: Single hammer candle (long lower wick, small body at top) followed by strong green candle—similar reversal signal with different structure
What Makes the Morning Star Distinct
The morning star pattern stands out from these related patterns because of its three-phase structure—selling continuation, indecision pause, buying reversal. This makes it more methodical than two-candle patterns that show faster transitions.
The abandoned baby is technically a morning star variation but so rare that most traders go years without seeing a legitimate one. The gaps on both sides of the middle candle create complete separation, which almost never happens in modern markets where overnight gaps are less common than they were in earlier trading eras.
The piercing pattern compresses the morning star's message into two candles, which makes it more frequent but slightly less reliable. You lose the middle candle's indecision phase, jumping straight from selling to buying. It works, but the three-candle progression of the morning star provides more confirmation that the reversal is genuine.
What makes the morning star pattern particularly useful is that middle candle—the pause that shows momentum stalling before reversal. Single-candle reversals like hammers can work but lack that interim confirmation. Two-candle patterns are faster but miss the three-day narrative. The morning star's structure captures the full psychological shift from sellers exhausting themselves, to uncertainty, to buyers taking control.
Remember: While variations exist, the classic morning star pattern with its three distinct candles—large bearish, small indecision, large bullish—remains the most recognized and traded version because that structure clearly telegraphs the sentiment shift from selling to buying.
Common Mistakes and Failures


The morning star pattern fails often enough that you need to recognize the conditions that increase failure rates. Most losses come from trading weak patterns, ignoring context, or entering without proper confirmation rather than from the pattern itself being unreliable.
Mistakes that undermine morning star trades:
-
No confirmation waiting: Entering during the second or early in the third candle before the pattern actually completes and confirms
-
Ignoring trend context: Trading morning stars that appear during uptrends or sideways action where there's no downtrend to reverse
-
Weak candle structure: Trading patterns where all three candles are similar size without the large-small-large contrast that makes the pattern meaningful
-
Low volume acceptance: Taking patterns that form on declining or below-average volume without the participation needed for reversal
-
No support confluence: Trading morning stars in the middle of nowhere without any technical reason to expect buyers at that price level
-
Fighting the market: Taking bullish morning stars while the broader market is in strong downtrend—individual patterns get overwhelmed
-
Missing resistance overhead: Entering patterns with major resistance sitting just above, leaving no room for the reversal to develop
-
Premature entry: Buying before the third candle closes, hoping it will complete properly—turning a decent setup into a gamble
-
Pattern forcing: Drawing the pattern where it doesn't quite fit because you want to see it—subjective trendline adjustment to make it work
-
Fourth candle ignore: Not checking what happens after the pattern completes—missing the immediate failure signal when the fourth candle reverses
-
Oversized position: Betting too much because the pattern "looks perfect"—forget risk management for high conviction
Why These Failures Happen
Traders learn about the morning star pattern and start seeing potential formations everywhere. The excitement of pattern recognition leads to taking marginal setups that don't meet the criteria or appear in contexts where reversal is unlikely. A small-bodied first candle, tiny third candle, or pattern appearing during an uptrend all violate the basic requirements, but traders take them anyway.
The most common failure is entering too early. You see the first two candles form and convince yourself the third will be bullish, so you buy before it completes. Then the third candle opens lower and continues down, and you're holding a losing position in what never became a morning star pattern at all. Patience to wait for completion filters out most failed trades.
Volume and support confluence separate high-probability morning star patterns from low-probability ones that just happen to have the right shape. A morning star on declining volume at a random price level has maybe a 40-50% success rate. A morning star on expanding volume right at the 200-day moving average with RSI oversold has a 65-70% success rate. The difference comes from confirmation and context, not from the pattern itself.
Making the Morning Star Pattern Work


Three-candle reversal patterns like the morning star capture psychological shifts that single-candle patterns can't. The progression from continuation to indecision to reversal tells a story that's more complete than one hammer candle or one engulfing pattern. That narrative structure is what makes the morning star reliable when properly formed and confirmed—but it also requires patience that many traders don't have.
Pattern Recognition in Context
Learning to spot the morning star pattern is quick. Learning when to trade it and when to pass takes longer. You'll see potential morning stars frequently if you scan enough charts, but most won't appear in contexts where the odds genuinely favor reversal. The pattern at the bottom of a 20% decline near major support with volume confirmation is different from the same shape appearing after a 3% pullback in the middle of an uptrend.
The morning star pattern works best as one piece of evidence in a larger case for reversal. When you see the pattern form at a prior low, with RSI oversold, on increasing volume, while the broader market is supportive, you have multiple reasons to expect higher prices. The pattern alone gives you a signal. The confluence of supporting factors gives you confidence that the signal is worth acting on.
Pattern recognition without context turns into pattern obsession—seeing formations everywhere and trading them all regardless of whether conditions support follow-through. The skill isn't just identifying the morning star shape. It's evaluating whether this particular morning star, in this location, with this volume, in this market environment, deserves your capital. Most don't. The ones that do tend to work well enough to make up for the patience required.
The Bottom Line: The morning star pattern signals potential bullish reversal through its three-candle structure, but probability improves dramatically when you combine pattern recognition with confirmation, support confluence, volume analysis, and market context—treating it as certainty rather than probability is how traders turn a useful signal into a string of preventable losses.


