


Understanding the Bear Flag Pattern


The bear flag pattern is a continuation formation that appears during downtrends, signaling that the decline will likely resume after a brief pause. It gets its name from the visual resemblance to a flag on a pole—a sharp drop (the flagpole) followed by a small upward-sloping consolidation (the flag) before the decline continues. This pattern is one of the more reliable technical setups because it captures a natural rhythm in how downtrends develop: sharp selling, brief rest, then more selling.
What Makes It a Continuation Pattern
Continuation patterns differ from reversal patterns in their purpose and location. Reversal patterns signal that a trend is ending and price will change direction—like a head and shoulders at a top or a double bottom. Continuation patterns signal that the current trend will resume after a temporary pause—they're rest periods, not endings.
The bear flag is a bearish continuation pattern, meaning it appears within downtrends and suggests more downside is coming. The sharp initial decline creates the flagpole, showing strong selling pressure. Then price consolidates in a small upward-drifting channel—this is the flag. That upward drift tricks some traders into thinking the downtrend is over, but it's actually just profit-taking and weak buying that can't sustain itself.
Where Bear Flags Appear
Bear flags only work as continuation signals when they appear in specific contexts within established downtrends.
Location requirements for valid bear flags:
-
Appears after a clear downtrend has already begun—price making lower lows and lower highs for at least several sessions
-
Forms in the middle of a decline, not at tops before selloffs start
-
The flagpole (initial sharp drop) should be at least 10-15% or represent a significant move in the timeframe you're trading
-
Flag consolidation slopes upward against the prevailing downtrgeneral trend, creating the counter-trend bounce
-
Pattern typically develops over 1-3 weeks on daily charts, though timeframes vary
-
Multiple bear flags can appear in extended downtrends—each one pauses before the next leg down
The bear flag pattern combines a sharp decline with a weak counter-trend bounce that slopes upward, creating a visual structure that looks like a flag on a pole—and it only works as a bearish continuation signal when it appears during an established downtrend, not at market tops or during uptrends.
Anatomy of the Bear Flag Pattern


Breaking down the bear flag into its component parts shows you what to look for when scanning charts for potential continuation setups. The pattern has two distinct phases—the sharp decline that creates the pole, and the upward-sloping consolidation that creates the flag. Understanding both phases and how they relate helps you identify legitimate bear flags and avoid forcing the pattern onto price action that doesn't qualify.
The Flagpole: Sharp Decline
The flagpole is the initial sharp drop that precedes the flag consolidation. This isn't a slow grind lower—it's a decisive move that shows sellers are in control and pushing price down aggressively. The flagpole typically forms over 1-5 days on daily charts, dropping 10-20% or more depending on the stock and market conditions.
Volume on the flagpole should be elevated, confirming that real selling pressure is driving the decline rather than just light trading creating a visual drop. This sharp move exhausts some sellers in the short term, setting up the pause that becomes the flag. Without a strong, decisive flagpole, you don't have a bear flag—you just have choppy downward movement.
The Flag: Upward Sloping Consolidation
After the sharp drop, price consolidates in a small upward-drifting channel. This is the flag portion of the pattern, and it's what gives the formation its name.
Flag characteristics:
-
Forms a parallel or slightly converging channel with both trendlines sloping upward
-
Price bounces between upper resistance and lower support lines
-
The upward slope is counter to the prevailing downtrend—a weak relief rally
-
Consolidation typically lasts 1-3 weeks on daily charts, though it can be shorter or longer
-
Volume declines during flag formation as urgency fades and traders wait for direction
-
Flag should be smaller than the flagpole—usually retraces 38-50% of the flagpole's decline
Pattern Requirements
Understanding when you have a valid bear flag versus random price movement requires checking specific conditions.
IF the initial decline (flagpole) drops at least 10-15% in a sharp move… THEN you have the foundation for a bear flag—weak moves don't create strong patterns.
IF the consolidation that follows slopes upward in a channel… THEN you're seeing the counter-trend bounce that characterizes the flag portion.
IF volume declines during the flag formation… THEN it confirms that the selling pressure is pausing, not that buyers are taking control.
IF the flag consolidation is as large or larger than the flagpole… THEN it's probably not a bear flag—the consolidation should be proportionally smaller.
IF the flag develops over less than a week on daily charts… THEN it might be too quick to represent genuine consolidation—legitimate flags take time.
Volume Characteristics
Volume behavior throughout the bear flag pattern provides confirmation that what you're seeing represents genuine continuation rather than reversal.
Volume patterns in bear flags:
-
High or above-average volume during the flagpole decline—confirms selling pressure
-
Declining volume during the flag formation—shows the bounce is weak and lacks conviction
-
Volume should be lower during the flag than during the flagpole by at least 30-50%
-
Breakdown below the flag should occur on expanding volume—at least 50% above the flag's average
-
Low volume during the flag with high volume on breakdown is the ideal sequence
-
If volume increases during the flag formation, the pattern becomes less reliable
The Psychology Behind Bear Flags


The bear flag pattern tells a story about market psychology during downtrends. Each phase represents a shift in sentiment and behavior—from panic selling, to exhaustion and brief hope, to renewed fear when reality sets in. Understanding what's happening psychologically helps you recognize when the pattern is genuine versus when it's just random price movement.
What Happens During Each Phase
The psychological progression through a bear flag explains why the pattern works as a continuation signal.
The bear flag phases:
-
Flagpole (panic selling): Bad news, earnings miss, or market weakness triggers aggressive selling—participants rush to exit, creating the sharp drop with elevated volume
-
Early flag (exhaustion): Sellers who wanted out got out during the flagpole—remaining holders aren't panicking yet, creating a temporary pause
-
Mid-flag (false hope): Price drifts upward on light volume as some bargain hunters step in and shorts take profits—this looks like recovery but lacks conviction
-
Late flag (reality check): The upward bounce fails to attract sustained buying—participants realize the downtrend isn't over and prepare for more downside
-
Breakdown (renewed fear): Price breaks below flag support, confirming the downtrend continues—stops trigger, shorts re-enter, and selling accelerates
Why the Counter-Trend Bounce Fails
The upward-sloping consolidation that forms the flag looks bullish at first glance—higher lows suggest buyers are stepping in. But this bounce is weak by design, which is why it ultimately fails and the downtrend resumes.
The bounce lacks the characteristics of genuine reversals. Volume declines during the flag, showing that buying interest is minimal. The retracement is shallow, typically only recovering 38-50% of the flagpole's decline rather than the 61.8% or more you'd see in stronger corrections. Price struggles to make progress higher, grinding slowly upward in a tight channel rather than rallying with conviction.
Participants who bought the bounce hoping for recovery start getting nervous as the flag extends and price can't break higher. Meanwhile, sellers are watching, waiting for the bounce to exhaust itself so they can resume selling at better prices. Shorts who covered during the flagpole look to re-enter. This imbalance of weak buyers and patient sellers creates conditions where the breakdown becomes inevitable once support fails.
The Bottom Line: The bear flag pattern works because it captures a predictable psychological sequence—panic selling exhausts itself temporarily, creating a weak counter-trend bounce that attracts hopeful buyers, but the bounce can't sustain on low volume and shallow retracement, so when support breaks, selling pressure returns and the downtrend continues.
Bear Flag vs. Bull Flag


The bear flag and bull flag are mirror images of each other, appearing in opposite trend contexts with opposite implications. Understanding both patterns helps you avoid the common mistake of confusing one for the other, which happens when traders focus on the shape without checking the surrounding trend.
The Mirror Relationship
Bull flags and bear flags have the same structural components but inverted orientations and trend requirements.
Did You Know? Bull flags form during uptrends with a sharp rally (flagpole) followed by a downward-sloping consolidation (flag), then break out higher to continue the uptrend—they're the bullish continuation equivalent of bear flags.
Did You Know? The flag portion always slopes against the prevailing trend—bear flags slope upward during downtrends, bull flags slope downward during uptrends—this counter-trend drift is what creates the flag shape in both patterns.
Did You Know? Both patterns require declining volume during the flag formation and expanding volume on the breakout/breakdown to confirm continuation—the volume behavior is identical despite opposite directional implications.
Why Trend Context Determines Everything
The visual structure of a flag pattern means nothing without knowing what happened before it formed. A downward-sloping consolidation after a rally is a bull flag. The exact same downward-sloping consolidation at the top of a downtrend would be something else entirely—maybe a falling wedge reversal or just random consolidation.
This is why traders who memorize patterns without understanding context fail. They see a small upward-sloping channel and think "that looks like a flag" without checking if there was a sharp decline before it. Or they see a downward-sloping channel and call it a bear flag when it's actually a bull flag in an uptrend. The shape alone doesn't tell you whether the pattern is bullish or bearish—the trend context does.
Key Differences Between Bull and Bear Flags
While the structures mirror each other, understanding the specific characteristics of each helps you identify them correctly.
Comparing the two patterns:
-
Bull flag: Sharp rally (flagpole), downward-sloping consolidation (flag), breakout higher (continuation)
-
Bear flag: Sharp decline (flagpole), upward-sloping consolidation (flag), breakdown lower (continuation)
-
Bull flag context: Appears during established uptrends with higher highs and higher lows
-
Bear flag context: Appears during established downtrends with lower lows and lower highs
-
Bull flag slope: Flag slopes downward against the uptrend—profit-taking creates the downward drift
-
Bear flag slope: Flag slopes upward against the downtrend—short covering and weak buying create the upward drift
-
Bull flag resolution: Breaks above flag resistance to resume uptrend
-
Bear flag resolution: Breaks below flag support to resume downtrend
-
Both patterns: Require declining volume during flag, expanding volume on breakout/breakdown
Identifying Valid Bear Flags


Not every downward move followed by an upward bounce qualifies as a bear flag. The pattern has specific requirements that separate legitimate continuation setups from random price movement that happens to look vaguely flag-like. Being selective about which formations you trade as bear flags improves your success rate dramatically.
Criteria for valid bear flag identification:
-
Established downtrend: Stock must already be in a downtrend with at least one clear leg down before the flag forms—no downtrend means no continuation pattern
-
Sharp flagpole: The initial decline should be steep and decisive, dropping 10-20% or more over just a few days—slow grinds don't create flags
-
Counter-trend flag: The consolidation must slope upward against the downtrend—horizontal or downward-sloping consolidations are different patterns
-
Parallel channel: The flag should form between two roughly parallel trendlines, or slightly converging—wild swings don't qualify
-
Proportional sizing: Flag consolidation should be smaller than the flagpole, typically retracing 38-50% of the pole's decline
-
Declining volume: Volume during the flag should be lower than volume during the flagpole by at least 30-50%
-
Multiple touches: Each trendline (upper resistance and lower support) should have at least two clear touches to define the channel
-
Adequate duration: Flag should take at least 5-10 days on daily charts to form—anything faster is likely noise
-
Clean structure: The flag should be visually obvious without forcing trendlines or cherry-picking touch points
Timeframe Considerations
Bear flags appear on all timeframes, but reliability and trading implications change depending on the chart you're viewing.
Daily charts are the most common timeframe for identifying and trading bear flags. The flagpole typically forms over 1-5 days, and the flag consolidation lasts 1-3 weeks. This gives you enough time to identify the pattern, wait for confirmation, and execute the trade without the noise that plagues shorter timeframes.
Intraday timeframes like 5-minute or 15-minute charts show flag-like patterns frequently, but these are less reliable because of increased noise and volatility. What looks like a bear flag on a 5-minute chart might just be random lunch-hour chop. If you trade intraday bear flags, require stricter confirmation and tighter risk management than you would on daily charts.
Weekly charts produce bear flags that take months to develop and signal major continuation moves. These are rare but powerful when they appear. A bear flag on a weekly chart with a flagpole that drops 20-30% over several weeks and a flag that consolidates for 2-3 months represents institutional-scale positioning. These patterns work but require patience that most traders don't have.
Remember: A valid bear flag requires an established downtrend, a sharp decisive flagpole, an upward-sloping flag consolidation on declining volume, and clean parallel channel structure—if you're forcing trendlines or ignoring the absence of a preceding downtrend, you're not looking at a legitimate bear flag pattern.
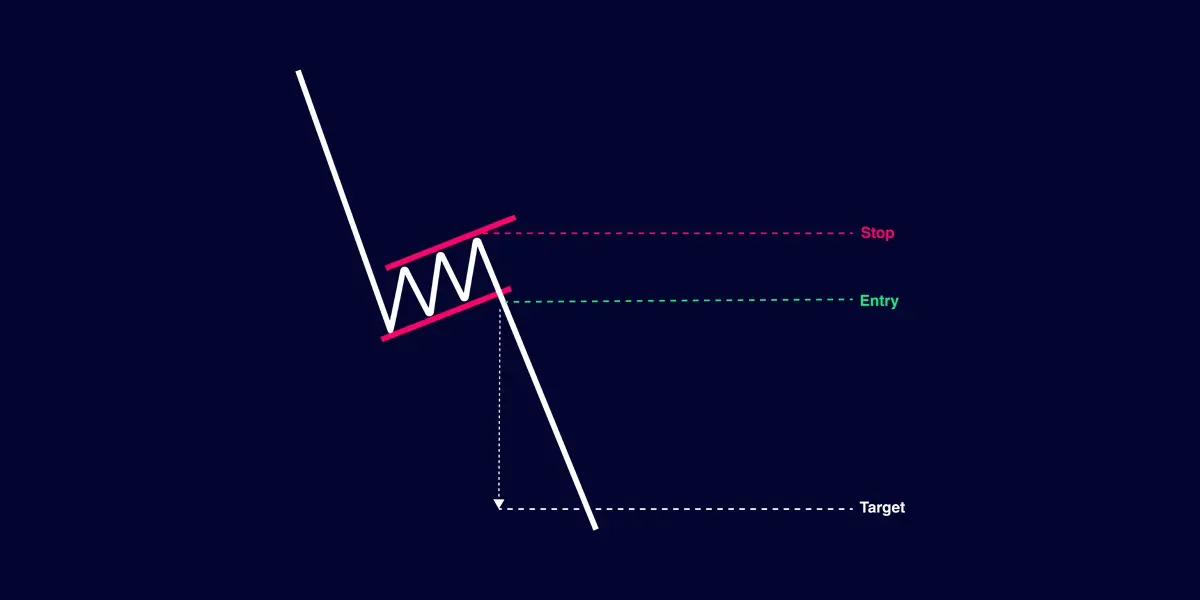
Trading the Bear Flag


Trading bear flags means waiting for the breakdown below the flag's support line, then entering short or exiting long positions with clear stop levels and profit targets. The pattern provides a structured framework for managing risk and reward, but only when traded with proper confirmation and patience.
Key trading steps for bear flags:
-
Wait for breakdown: Enter when price closes decisively below the lower support line of the flag—don't anticipate the breakdown before it happens
-
Confirm with volume: Breakdown should occur on at least 50% higher volume than the flag's average—low volume breakdowns often fail
-
Set stop loss: Place stop above the flag's upper resistance line or the most recent swing high within the flag
-
Calculate target: Measure the flagpole height (top to bottom) and project that distance downward from the breakdown point
-
Enter conservatively: Wait for the close below support, then enter at next open or on a retest of broken support
-
Enter aggressively: Use a limit order just below the support line for better price, accepting higher risk of false breakdown
-
Scale position: Enter half position on breakdown, add second half if price continues lower and doesn't reverse back into flag
Entry Timing and Stop Placement
The difference between a profitable bear flag trade and a stopped-out loss often comes down to entry timing and where you place your stop.
Conservative entry means waiting for the daily candle to close below the flag's lower support line, then entering at the open of the next session or waiting for a retest of the broken support. This confirmation reduces false breakdown risk but gives you a worse entry price. If the stock gaps down after breaking support, you might miss the ideal entry entirely.
Aggressive entry means placing a limit order slightly below the flag's support line, entering as soon as price touches that level intraday. This gets you in at a better price but carries higher risk—price could wick below support then rally back into the flag, stopping you out before the real breakdown occurs. Aggressive entries work better for experienced traders who can handle the increased failure rate.
Quick tip: Place your stop 2-3% above the flag's upper resistance line rather than exactly at the line—this prevents getting stopped out by a brief spike that immediately reverses back down.
Quick tip: If the flag is unusually tall (retracing more than 50% of the flagpole), consider passing on the trade or using a smaller position—large flags often fail because they show too much buying strength.
Quick tip: After the breakdown, if price retests the broken support and rejects it, that's a high-probability entry point with tighter risk than the initial breakdown.
Profit Targets and Position Sizing
Setting realistic targets and appropriate position sizes separates disciplined bear flag traders from those who hold too long or bet too much.
Target and sizing considerations:
-
First target: Project the flagpole's height downward from the breakdown point—this is your minimum measured move
-
Second target: Identify the next major support level below the flag—prior swing low, round number, or moving average
-
Scaling out: Exit half position at first target, hold remainder for second target or trailing stop
-
Time consideration: Most bear flags reach their measured target within 1-2 weeks of breakdown—if it takes longer, momentum may be fading
-
Position sizing: Risk 1-2% of your account on the trade, with share quantity determined by the distance from entry to stop
-
Smaller size for shorts: Consider sizing bear flag shorts at 50-75% of what you'd risk going long—shorting carries different risks
-
Account for slippage: Less liquid stocks may have wider spreads on breakdown—factor this into position sizing
The bear flag pattern provides clear entry points on breakdown below support, logical stop placement above the flag, and measurable profit targets based on the flagpole height—but trading it successfully requires volume confirmation, patience for breakdown, and disciplined risk management rather than anticipating the move before it happens.
Measuring Targets


Setting profit targets for bear flag trades uses a straightforward measuring technique based on the flagpole's height. This gives you an objective target rather than guessing how far the decline will go. The method isn't perfect—some moves exceed the target while others fall short—but it provides a logical framework for planning your exit.
The Measuring Technique
The standard approach for projecting bear flag targets uses the flagpole as your measurement tool.
DO: Measure the vertical distance from the top of the flagpole (where the decline started) to the bottom of the flagpole (where the flag consolidation began)
DO: Project that same distance downward from the breakdown point where price closes below the flag's support
DO: Use this measured move as your first target—the minimum expected decline if the pattern works
DO: Check for support levels below the flag that might stop the decline before reaching the measured target
DON'T: Measure from random points mid-flag—the measurement must be from the flagpole top to bottom
DON'T: Assume price will always reach the target—measured moves are probabilities, not guarantees
DON'T: Hold through clear support levels hoping to reach the target—sometimes the smart exit is before the mathematical projection
DON'T: Ignore price action after the breakdown—if momentum stalls halfway to target, take your profit
Target Scenarios
Understanding how different scenarios affect target achievement helps you adjust your exit strategy based on what happens after the breakdown.
IF the measured target projects to a major support level like a prior low or round number… THEN expect resistance at that level and consider exiting at least partial position before reaching it.
IF the breakdown occurs on massive volume (2-3x average)... THEN the move often exceeds the measured target—consider holding for extended targets beyond the projection.
IF price reaches the measured target within 1-2 days of breakdown… THEN the move was efficient and likely exhausted—take profit rather than expecting further immediate decline.
IF price stalls halfway to the target and starts consolidating or bouncing… THEN momentum may be fading—consider exiting rather than holding for the full target.
IF multiple support levels sit between the breakdown and the measured target… THEN expect a choppy decline with potential for early exit at the first significant support.
Support Levels That Interfere
Support levels below the bear flag can prevent price from reaching the full measured target. Identifying these obstacles helps you set realistic expectations.
Potential interference points:
-
Prior swing lows where price reversed before—these levels have historical significance
-
Round numbers like $50, $25, $10—psychological levels where buyers tend to step in
-
Major moving averages like the 200-day MA—widely watched levels that attract buying
-
Volume profile high-volume nodes—price areas where significant trading occurred previously
-
Gap fill levels—unfilled gaps below create magnetic pull that might stop the decline
-
Fibonacci retracement levels from longer-term uptrends—institutional traders watch these
When to Exit Early
Holding for the full measured target works sometimes, but recognizing when to exit early prevents giving back profits when patterns don't reach their full potential.
Price action that suggests early exit includes slowing momentum as the decline approaches support—candles getting smaller, wicks increasing, volume declining. If the sharp selling that characterized the flagpole and initial breakdown disappears, the move is losing steam. Time also matters—if reaching the target is taking much longer than expected, the pattern is struggling and early exit makes sense.
Watch for reversal signals like hammer candles, bullish engulfing patterns, or volume spikes on up days near potential support levels. These suggest buyers are stepping in and the decline might pause or reverse before hitting your target. Taking profit at 75-80% of the measured move when you see these signals often beats holding for the full target and watching price reverse against you.
Common Mistakes


Bear flag patterns fail or lead to losses when traders make predictable errors in identification, timing, or risk management. Most mistakes come from forcing patterns where they don't exist, entering too early, or ignoring the context and confirmation signals that separate high-probability setups from traps.
Mistakes that undermine bear flag trades:
-
Wrong trend context: Trading bear flags that appear during uptrends or sideways markets—the pattern requires an established downtrend to be valid
-
Premature entry: Entering short before the breakdown occurs because the flag "looks ready"—price can consolidate within the flag for days or weeks longer
-
Volume ignorance: Taking bear flags where volume increases during the flag formation instead of declining—rising volume suggests buying strength, not weakness
-
Breakdown without volume: Entering on breakdowns that occur on light or declining volume—these often reverse quickly as false breaks
-
Forced trendlines: Drawing channel lines on choppy consolidation that doesn't have clear parallel structure—seeing flags where only noise exists
-
No flagpole: Identifying flags without a preceding sharp decline to create the pole—you need both components for a valid pattern
-
Oversized flags: Trading patterns where the flag consolidation is as large or larger than the flagpole—these show too much buying strength to be reliable
-
Pattern confusion: Mistaking bear flags for other patterns like falling wedges, descending triangles, or downward channels—each has different implications
-
Horizontal flags: Calling horizontal consolidation a bear flag when true flags slope upward against the downtrend
-
Stop denial: Not exiting when price breaks above the flag instead of below—refusing to accept the pattern failed
-
Target obsession: Holding for the full measured move even when price stalls or support appears—ignoring what the market is showing you
Why These Failures Happen
The most common error is trading bear flags without confirming a downtrend exists first. Traders see a sharp drop followed by an upward drift and immediately think "bear flag" without checking what came before. If that sharp drop was just a pullback in an ongoing uptrend, the pattern isn't a bear flag—it's a bull flag or something else entirely. Context determines everything.
Entering before breakdown confirmation kills otherwise good setups. You see the flag forming and think you'll get a better price by shorting early, but price continues bouncing within the flag for another week, stops you out, then finally breaks down after you've exited. Patience to wait for the breakdown below support filters out these premature entries and false patterns that never complete.
Volume mistakes happen because traders focus on the visual pattern and ignore the volume bars. A bear flag with increasing volume during the flag formation is warning you that buyers are getting stronger, not weaker. The breakdown might still occur, but it's more likely to fail. Declining volume during the flag is what confirms the bounce is weak—without that confirmation, you're trading a shape rather than a high-probability setup.
The Bottom Line: Bear flag patterns fail most often when traded in the wrong trend context, entered before breakdown confirmation, or identified on consolidations that lack the required structure—success comes from waiting for established downtrends, sharp flagpoles, upward-sloping flags with declining volume, and breakdown confirmation before entry rather than forcing patterns onto price action that doesn't qualify.
Bear Flags in Different Market Conditions


Bear flag patterns don't work equally well in all market environments. Success rates vary based on the broader market trend, volatility levels, and the liquidity of the stocks you're trading. Understanding which conditions favor bear flags helps you pick the best setups and avoid patterns likely to fail.
How market conditions affect bear flags:
-
Strong bear markets: Bear flags work exceptionally well when the overall market is in confirmed downtrend—individual stock patterns get support from broader selling pressure
-
Bull market corrections: Bear flags during corrections within bull markets are less reliable—the broader uptrend can override individual bearish patterns
-
High volatility (VIX elevated): Increased volatility makes breakdowns more violent but also increases false breakdown risk—wider stops required
-
Low volatility (VIX suppressed): Bear flags develop more slowly and reach targets less explosively, but patterns tend to be cleaner and more reliable
-
High liquidity stocks: Large-cap, high-volume stocks produce cleaner bear flags with tighter spreads on entry and exit
-
Low liquidity stocks: Small-cap or thinly traded stocks show wider spreads, slippage on breakdown, and higher false breakdown rates
-
Sector weakness: Bear flags in stocks whose entire sector is declining work better than isolated weakness in strong sectors
-
News-driven markets: Bear flags during periods of heavy news flow are less predictable—fundamental catalysts can override technical patterns
Optimal Conditions for Bear Flags
Bear flag patterns reach their measured targets most consistently when specific market conditions align to support the bearish continuation.
Ideal conditions:
-
Overall market (S&P 500) in downtrend or at least neutral—not fighting against strong bull market momentum
-
VIX elevated but not in extreme panic levels—enough fear to maintain selling but not so much that everything becomes unpredictable
-
Stock's sector showing relative weakness compared to broader market—confirms the decline has fundamental support
-
Average daily volume above 500,000 shares—provides liquidity for entry and exit without excessive slippage
-
Clear downtrend established over multiple weeks before the flag forms—not just a one-day spike down
-
No major earnings or news events scheduled during the projected target timeframe—reduces fundamental override risk
-
Multiple bear flags forming across different stocks—confirms broader market weakness rather than isolated selling
Keep In Mind: Bear flag patterns work best in confirmed bear markets or strong sector downtrends with moderate volatility and adequate liquidity—trying to trade them during bull market corrections, in low-volume stocks, or when the broader market is rallying significantly reduces success rates regardless of how perfect the individual pattern looks.
Making Bear Flag Patterns Work


Bear flags are among the more reliable continuation patterns in technical analysis, but reliability doesn't mean certainty. The pattern works because it captures a natural rhythm in downtrends—sharp selling, weak bounce, resumed selling—that repeats consistently across timeframes and markets. When properly identified and traded with confirmation, bear flags offer favorable risk/reward setups where the measured target provides clear profit objectives and the flag structure defines logical stop placement.
Context and Patience
The bear flag pattern only works as a bearish continuation signal when it appears during established downtrends. This requirement can't be overstated—more traders fail with bear flags by ignoring trend context than by any other mistake. A sharp drop followed by an upward-sloping consolidation isn't automatically a bear flag. If that pattern forms during an uptrend, it's probably a bull flag or something else entirely. Check what was happening for weeks before the pattern formed, not just the immediate price action.
Patience for proper formation separates profitable bear flag trades from premature entries that get stopped out. The flagpole needs to be sharp and decisive, not a slow grind. The flag needs to develop over days or weeks with declining volume, not form in just a couple of sessions. And the breakdown needs to occur with volume confirmation before you enter. Rushing any of these steps because you're afraid of missing the move leads to taking marginal patterns that fail at higher rates than the textbook setups you waited for.
Risk management on bearish patterns deserves extra attention because shorting carries different risks than going long. Markets tend to go up over time, short squeezes can be violent, and overnight gaps can move against shorts dramatically. This is why many experienced traders size bear flag positions smaller than long positions—perhaps 50-75% of their typical risk—despite the pattern's reliability. The asymmetric risk profile of shorting demands more conservative position sizing even when the setup looks perfect.


