


Understanding the Wedge Pattern


Wedge patterns are chart formations where price moves between two converging trendlines, creating a narrowing range that eventually leads to a breakout. They're useful because they signal when a trend is losing momentum and preparing to either reverse or continue with renewed energy. The challenge is that wedges can go either direction depending on context—a rising wedge can be bearish, a falling wedge can be bullish, and both can act as either reversals or continuations.
Basic wedge characteristics:
-
Two trendlines that converge toward each other as price oscillates between them
-
Rising wedge: both trendlines slope upward with higher highs and higher lows
-
Falling wedge: both trendlines slope downward with lower lows and lower highs
-
Formation takes minimum 3-4 weeks on daily charts to be meaningful
-
Volume typically declines as the pattern develops toward the apex
-
Breakout occurs when price breaks through one of the trendlines with volume confirmation
The Reversal vs. Continuation Confusion
Most traders learn that rising wedges are bearish and falling wedges are bullish, which is true most of the time. But wedges can also act as continuation patterns depending on where they appear. A rising wedge after an uptrend usually signals bearish reversal. A rising wedge within a downtrend can signal bearish continuation—the pattern is just a pause before the downtrend resumes.
This creates confusion because the same visual pattern means different things in different locations. You can't just see converging trendlines sloping upward and automatically assume it's bearish. You need to check what was happening before the wedge formed. If the stock was rallying, the rising wedge is probably a reversal signal. If the stock was declining, the rising wedge might be a continuation pattern disguised as a counter-trend bounce.
Why Context Determines Everything
The wedge pattern itself is just a narrowing range between two trendlines. What gives it meaning is the trend that preceded it and where it appears on the chart. Context transforms a neutral geometric shape into a tradeable signal.
A falling wedge at the bottom of a six-month decline is a bullish reversal setup. The exact same falling wedge appearing during an uptrend as a brief pullback is a bullish continuation setup. Same pattern, same converging downward trendlines, different implications entirely. The visual structure is identical, but the trend context tells you whether the wedge is ending a trend or pausing within one.
The wedge pattern demonstrates a fundamental principle in technical analysis: the shape of the formation matters less than where it appears and what story it's telling about the battle between buyers and sellers within the context of the larger trend.
Anatomy of Wedge Patterns

Understanding what qualifies as a legitimate wedge pattern helps you avoid seeing wedges where none exist. The pattern has specific structural requirements—two converging trendlines, multiple touches on each line, sufficient formation time, and characteristic volume behavior. Miss any of these elements and you're looking at something else entirely.
Rising Wedge Structure
A rising wedge forms when price makes higher highs and higher lows, but the rate of advance slows with each swing. Both trendlines slope upward, but the lower support line rises faster than the upper resistance line, creating compression.
Rising wedge characteristics:
-
Both trendlines slope upward at an angle (not horizontal)
-
Lower trendline (support) has steeper slope than upper trendline (resistance)
-
Price makes higher swing highs but each rally is weaker than the last
-
Higher swing lows show buyers are still present but losing conviction
-
The gap between trendlines narrows as price approaches the apex
-
Pattern creates a cone or funnel shape pointing upward to the right
Falling Wedge Structure
A falling wedge forms when price makes lower lows and lower highs, but the rate of decline slows with each swing. Both trendlines slope downward, but the upper resistance line falls faster than the lower support line, creating compression.
Falling wedge characteristics:
-
Both trendlines slope downward at an angle (not horizontal)
-
Upper trendline (resistance) has steeper slope than lower trendline (support)
-
Price makes lower swing lows but each decline is less severe than the last
-
Lower swing highs show sellers are still present but losing strength
-
The gap between trendlines narrows as price approaches the apex
-
Pattern creates an inverted cone or funnel shape pointing downward to the right
Minimum Touches and Formation Time
A valid wedge pattern requires multiple contact points on each trendline to confirm the boundaries. You need at least two touches on each trendline to draw it, but three or more touches strengthen the pattern's reliability. If you can only find one swing high and one swing low, you don't have enough data points to define converging trendlines.
Formation time matters because wedges represent gradual momentum loss, not sudden shifts. On daily charts, legitimate wedge patterns take at least three to four weeks to develop. Anything forming in just a few days is likely noise or a different pattern. Weekly chart wedges can take several months. The compression needs time to build—buyers or sellers slowly exhausting themselves over multiple attempts rather than giving up instantly.
Volume Characteristics
Volume behavior during wedge formation provides confirmation that the pattern is genuine rather than random price movement between arbitrary trendlines.
Volume patterns in wedges:
-
Volume typically declines as the pattern develops toward the apex
-
Each successive swing shows lower volume than the previous swing
-
Declining volume confirms waning conviction—participants are losing interest
-
Breakout should occur on expanding volume, ideally 50-100% above average
-
Low volume breakouts are suspect and more likely to fail
-
Volume surge confirms genuine momentum shift rather than fake-out
The Bottom Line: A legitimate wedge pattern requires two clearly converging trendlines with at least two touches each, minimum three to four weeks of formation time, and declining volume as price compresses toward the apex—without these structural elements, you're forcing a pattern onto price action that doesn't actually fit the definition.
Rising Wedge: Typically Bearish
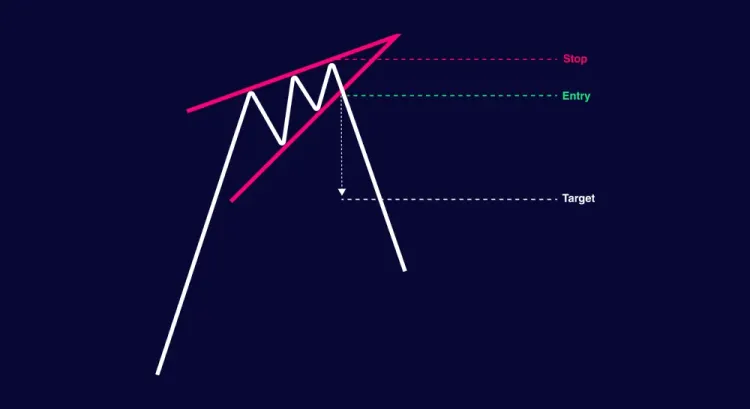
The rising wedge pattern slopes upward, which makes it counterintuitive that it's usually a bearish signal. Price is making higher highs and higher lows—the definition of an uptrend—yet the pattern warns that the advance is losing steam and a reversal or continuation of a prior downtrend is likely. Understanding why upward-sloping price action can be bearish is the key to trading rising wedges correctly.
When and Where Rising Wedges Appear
Rising wedges show up in two distinct contexts, and location determines whether they're reversal or continuation patterns.
IF a rising wedge forms after a sustained uptrend near resistance or prior highs… THEN it's typically a bearish reversal pattern warning that the rally is exhausting and a breakdown is coming.
IF a rising wedge forms during a downtrend as a counter-trend bounce… THEN it's typically a bearish continuation pattern showing the bounce is weak and the downtrend will resume.
IF price breaks below the lower support line of the rising wedge… THEN the pattern confirms bearish and traders look for downside targets based on the wedge height.
IF price somehow breaks above the upper resistance line instead… THEN the rising wedge pattern failed and the bearish thesis is invalidated.
IF volume is declining as the rising wedge develops… THEN it confirms that buyers are losing conviction despite higher prices—classic exhaustion signal.
Why Rising Wedges Are Bearish
The upward slope tricks traders into thinking the trend is healthy, but the converging trendlines reveal the truth. Each rally within the wedge is weaker than the last—measured by the narrowing distance between swings and declining volume.
Reasons rising wedges signal weakness:
-
Buyers push price higher but with less conviction each time—diminishing returns
-
The gap between highs and lows compresses, showing reduced volatility and interest
-
Volume declines during formation, proving participation is waning as price rises
-
Higher lows show buyers defending support, but the steeper slope means support is rising faster than resistance
-
This imbalance can't sustain—when support finally breaks, there's nothing underneath
-
The pattern represents distribution disguised as continuation—smart money exiting into strength
-
Once the lower trendline breaks, stops get triggered and selling accelerates
The rising wedge pattern is bearish despite its upward slope because the narrowing range and declining volume reveal that buyers are exhausting themselves pushing price higher—each rally requires more effort for less gain, creating unsustainable conditions that typically resolve with a breakdown once the lower support fails.
Falling Wedge: Typically Bullish
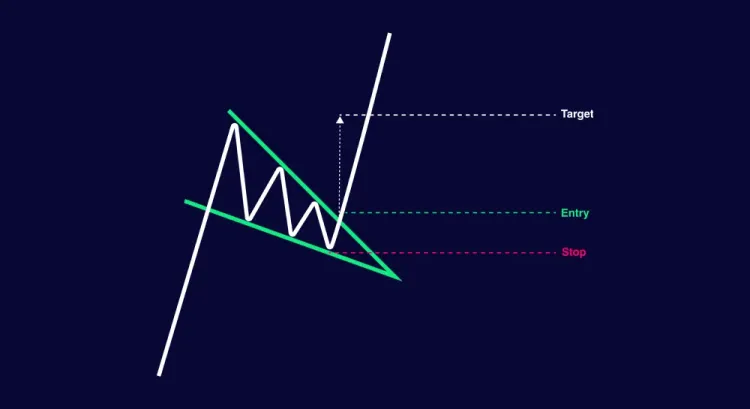
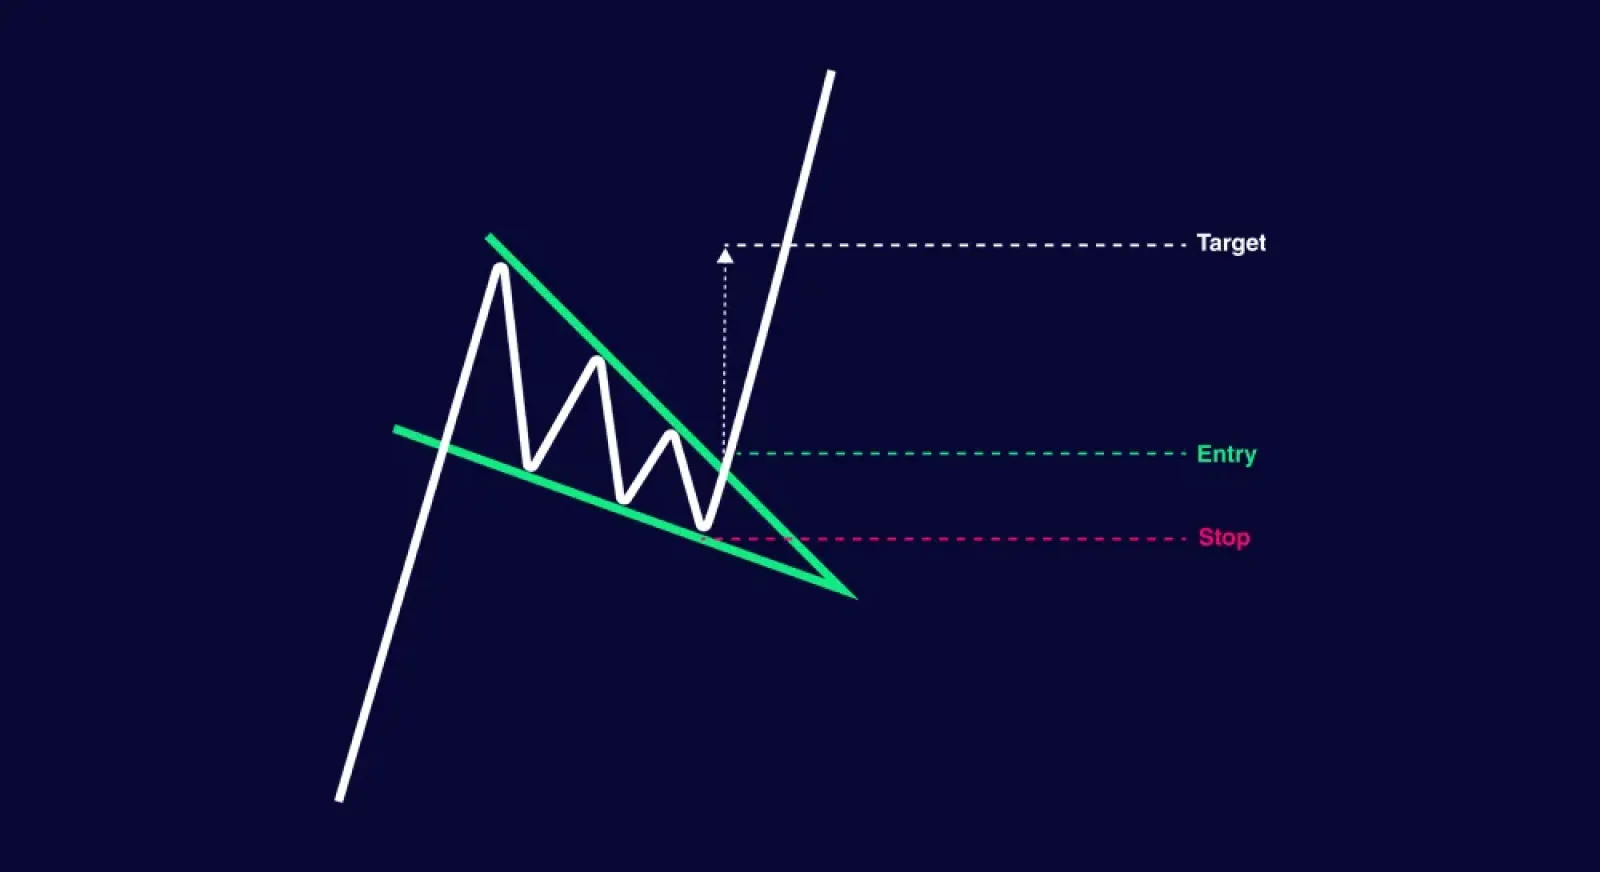
The falling wedge pattern slopes downward, which makes it counterintuitive that it's usually a bullish signal. Price is making lower lows and lower highs—the definition of a downtrend—yet the pattern suggests that the decline is losing momentum and a reversal or continuation of a prior uptrend is likely. The downward slope masks the underlying strength building within the pattern.
When and Where Falling Wedges Appear
Falling wedges show up in two distinct contexts, and location determines whether they're reversal or continuation patterns.
IF a falling wedge forms after a sustained downtrend near support or prior lows… THEN it's typically a bullish reversal pattern warning that the decline is exhausting and a breakout higher is coming.
IF a falling wedge forms during an uptrend as a pullback or consolidation… THEN it's typically a bullish continuation pattern showing the pullback is controlled and the uptrend will resume.
IF price breaks above the upper resistance line of the falling wedge… THEN the pattern confirms bullish and traders look for upside targets based on the wedge height.
IF price somehow breaks below the lower support line instead… THEN the falling wedge pattern failed and the bullish thesis is invalidated.
IF volume is declining as the falling wedge develops… THEN it confirms that sellers are losing conviction despite lower prices—classic exhaustion signal.
Why Falling Wedges Are Bullish
The downward slope makes the pattern look bearish, but the converging trendlines reveal weakness in the decline. Each selloff within the wedge is less severe than the last—measured by the narrowing distance between swings and declining volume.
Reasons falling wedges signal strength:
-
Sellers push price lower but with less conviction each time—diminishing pressure
-
The gap between highs and lows compresses, showing reduced selling urgency
-
Volume declines during formation, proving selling pressure is fading as price falls
-
Lower highs show sellers defending resistance, but the steeper slope means resistance is falling faster than support
-
This imbalance can't sustain—when resistance finally breaks, buying accelerates
-
The pattern represents accumulation disguised as weakness—smart money buying into fear
-
Once the upper trendline breaks, shorts cover and new buyers enter, fueling upside momentum
The falling wedge pattern is bullish despite its downward slope because the narrowing range and declining volume reveal that sellers are exhausting themselves pushing price lower—each decline becomes shallower and weaker, creating unsustainable conditions that typically resolve with a breakout once the upper resistance fails.
Reversal Wedges
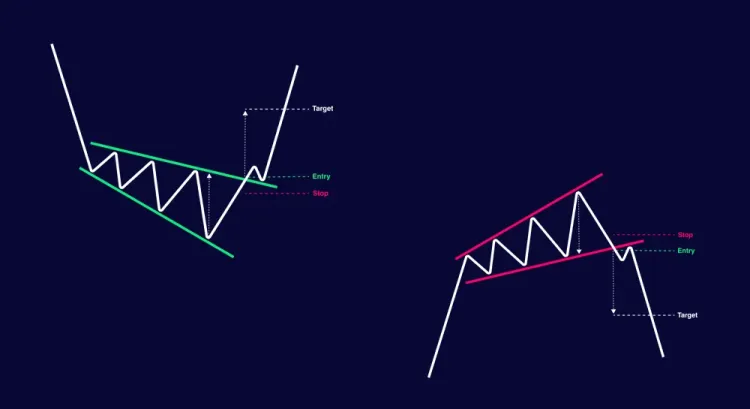

Reversal wedges are the most common and reliable application of wedge patterns. They appear at the end of extended trends when momentum is exhausting, signaling that the trend is about to reverse direction. Rising wedges reverse uptrends, falling wedges reverse downtrends, and both require specific location and context to be valid reversal signals.
Location and Context Requirements
Reversal wedges only work when they appear after clear, sustained trends. A wedge forming in the middle of nowhere without a preceding trend isn't a reversal—it's just noise.
IF you see a rising wedge and the stock has been in a strong uptrend for weeks or months… THEN the rising wedge is likely a bearish reversal pattern forming at the top, warning the rally is exhausting.
IF you see a falling wedge and the stock has been in a sustained downtrend for weeks or months… THEN the falling wedge is likely a bullish reversal pattern forming at the bottom, signaling the decline is losing steam.
IF the wedge forms near a major resistance level (for rising wedge) or support level (for falling wedge)... THEN the reversal signal is stronger because it aligns with a logical turning point.
IF volume declines as the wedge develops toward its apex… THEN it confirms exhaustion—participants are losing interest in continuing the trend.
IF the breakout occurs in the opposite direction of the preceding trend… THEN the reversal is confirmed and targets can be projected.
Breakout Direction and Targets
Reversal wedges resolve when price breaks through one of the converging trendlines, ideally with expanding volume that confirms the momentum shift is real.
Reversal wedge breakout characteristics:
-
Rising wedge breaks down through lower support line—bearish reversal confirmed
-
Falling wedge breaks up through upper resistance line—bullish reversal confirmed
-
Breakout should occur before reaching the apex, ideally in the final third of the pattern
-
Volume surge on breakout confirms genuine reversal rather than false break
-
Measuring target: take the height of the wedge (widest point) and project from the breakout point
-
Rising wedge target: measure height, project downward from breakdown point
-
Falling wedge target: measure height, project upward from breakout point
-
First target is typically the wedge height, but strong reversals can exceed the measured move
Reversal wedges appear after extended trends and signal exhaustion—rising wedges form at tops after uptrends and break down bearishly, while falling wedges form at bottoms after downtrends and break out bullishly, with declining volume during formation confirming momentum loss before the reversal breakout occurs.
Continuation Wedges


Most wedge patterns act as reversals—rising wedges ending uptrends, falling wedges ending downtrends. But wedges can also act as continuation patterns where they pause within a trend before it resumes. These are less common and often misidentified, which is why understanding the difference between reversal and continuation wedges matters for avoiding false signals.
Identifying Continuation vs. Reversal Wedges
The key difference is what was happening before the wedge formed. Reversal wedges appear after extended moves in one direction. Continuation wedges appear as pauses or corrections within a larger trend.
IF you see a rising wedge and the stock was in a downtrend before the wedge started forming… THEN the rising wedge is likely a bearish continuation—a weak counter-trend bounce within the downtrend that will fail.
IF you see a falling wedge and the stock was in an uptrend before the wedge started forming… THEN the falling wedge is likely a bullish continuation—a controlled pullback within the uptrend before resumption.
IF the wedge forms near the beginning or middle of a trend rather than at an extreme… THEN it's more likely to be continuation than reversal—trends don't typically reverse early.
IF the breakout direction matches the prior trend (down from rising wedge in downtrend, up from falling wedge in uptrend)... THEN you've correctly identified a continuation pattern and the trend is resuming with confirmation.
IF the wedge develops over a shorter timeframe than the preceding trend… THEN it's acting as brief consolidation rather than a major reversal pattern.
Characteristics of Continuation Wedges
Continuation wedges function as rest periods within trends, allowing the trend to digest recent gains or losses before continuing in the same direction.
How continuation wedges behave:
-
Appear as corrections against the prevailing trend—rising wedge during downtrend, falling wedge during uptrend
-
Form relatively quickly compared to reversal wedges—1-3 weeks rather than 4-8 weeks
-
Volume declines during formation as traders wait for direction confirmation
-
Breakout occurs in the direction of the original trend, not against it
-
Often smaller in height compared to reversal wedges—representing consolidation, not climax
-
Less common than reversal wedges, making them easier to misidentify
-
Require strong trend context to differentiate from reversals—without clear prior trend, assume reversal
Continuation wedges act as pause patterns within established trends rather than reversal signals, with rising wedges providing bearish continuation during downtrends and falling wedges providing bullish continuation during uptrends—but they're less common than reversal wedges and require clear trend context to identify correctly.
How to Identify Which Type You're Seeing


Spotting a wedge pattern on a chart is one thing—knowing whether it's a reversal or continuation pattern is what determines if you trade it correctly. The visual structure looks similar in both cases, so you need to analyze the context and characteristics that reveal which type you're dealing with.
Steps to identify reversal vs. continuation wedges:
-
Check the preceding trend first: Look back 4-8 weeks minimum to see what was happening before the wedge formed—strong uptrend suggests rising wedge reversal, strong downtrend suggests falling wedge reversal
-
Identify trend direction and strength: Rising wedge after uptrend = bearish reversal; rising wedge during downtrend = bearish continuation; falling wedge after downtrend = bullish reversal; falling wedge during uptrend = bullish continuation
-
Analyze volume pattern: Reversal wedges typically show more pronounced volume decline than continuation wedges—exhaustion creates apathy
-
Measure formation time: Reversal wedges take longer to develop (4-8+ weeks on daily charts) while continuation wedges form faster (1-3 weeks) as brief pauses
-
Assess wedge height: Larger wedges with significant price range typically signal reversals; smaller, tighter wedges often indicate continuation consolidation
-
Check slope steepness: Extreme slopes in wedges often appear in continuation patterns during strong trends; more moderate slopes appear in reversal patterns at exhaustion points
-
Look for support/resistance context: Reversal wedges form near key levels (prior highs for rising wedge, prior lows for falling wedge); continuation wedges form mid-trend away from extremes
-
Evaluate market environment: In strong bull markets, falling wedges lean toward continuation; in bear markets, rising wedges lean toward continuation
Making the Determination
The single most important factor is the trend that preceded the wedge formation. Everything else adds confirmation, but trend context is what separates reversal from continuation.
If you see a rising wedge and can't identify a clear uptrend before it, the pattern probably isn't a bearish reversal—it might be a continuation within a downtrend you haven't properly identified, or it might not be a meaningful pattern at all. The same logic applies to falling wedges. Without a clear downtrend preceding the pattern, calling it a bullish reversal is premature.
Time and size matter too. Big wedges that take two months to form and span 20-30% of the stock's price are making a statement about trend exhaustion. Small wedges that form in two weeks and span 5-7% are likely just pauses. The market doesn't spend months building a continuation pattern—it takes breaks quickly then resumes. Major reversals take time to develop as the trend slowly exhausts itself.
The most reliable way to identify which type of wedge pattern you're seeing is to check the preceding trend context—rising wedges after uptrends are bearish reversals, falling wedges after downtrends are bullish reversals, while wedges forming against the trend are likely continuation patterns, with volume decline, formation time, and pattern size providing additional confirmation of the pattern's intent.
Trading Rising Wedges


Trading rising wedges means waiting for the bearish breakdown through the lower support line, then entering short or exiting long positions. The pattern provides clear entry points, stop levels, and profit targets, but only when traded with proper confirmation and risk management.
DO: Wait for price to close decisively below the lower trendline before entering—don't try to anticipate the breakdown
DO: Look for volume expansion on the breakdown to confirm selling pressure is real—at least 50% above average volume
DO: Place your stop loss just above the wedge's upper trendline or recent swing high within the pattern
DO: Use the wedge height (measured at the widest point) as your minimum profit target, projected downward from the breakdown point
DO: Check if the breakdown aligns with other bearish signals like resistance overhead or declining moving averages
DON'T: Short the rising wedge before it breaks down just because it "looks ready to fall"—premature entries get stopped out
DON'T: Trust breakdowns on declining or light volume—these often reverse quickly as false breakouts
DON'T: Ignore your stop if price rallies back into the wedge—the pattern failed and you need to exit
DON'T: Trade rising wedges in strong bull markets where uptrend momentum can override individual bearish patterns
Entry, Stops, and Targets
Entry strategies and risk management for rising wedge breakdowns:
-
Conservative entry: Wait for the daily candle to close below the lower trendline, then enter at the open of the next session or on a retest of the broken support
-
Aggressive entry: Enter on a limit order just below the lower trendline when price breaks through intraday—faster but riskier
-
Stop placement: Set stop 2-3% above the upper trendline or above the most recent swing high within the wedge—if price returns above the pattern, it failed
-
First target: Measure the height from the top of the wedge to the bottom at the widest point, project that distance down from the breakdown point
-
Second target: Look for the next major support level below the pattern—prior swing lows, round numbers, or moving averages
-
Exit strategy: Cover half the position at first target, trail stop on remainder or hold for second target
When to Avoid Trading Rising Wedges
Not every rising wedge deserves a trade. Some patterns form in conditions where the bearish signal is likely to fail or where risk management becomes problematic.
Skip rising wedge trades when the pattern forms on light volume throughout, suggesting low participation and unreliable signals. Avoid trading wedges that develop in less than three weeks on daily charts—these are too quick to represent genuine exhaustion. Pass on rising wedges where the lower trendline is nearly horizontal rather than sloping upward—that's closer to an ascending triangle with different implications.
Don't trade rising wedges in the middle of strong bull markets where individual bearish patterns get overwhelmed by broader market momentum. If the S&P 500 is rallying hard and your stock's rising wedge is breaking down, the market context fights against your bearish thesis. Also avoid wedges where major support sits just below the pattern—there's no room for the breakdown to develop before hitting that floor.
Trading Falling Wedges


Trading falling wedges means waiting for the bullish breakout through the upper resistance line, then entering long positions. The pattern provides clear structure for entries, stops, and targets, but requires volume confirmation and proper context to avoid false breakouts that reverse quickly.
DO: Wait for price to close decisively above the upper trendline before entering—don't anticipate the breakout
DO: Confirm the breakout with volume expansion—ideally 50-100% above average daily volume
DO: Place your stop loss just below the wedge's lower trendline or recent swing low within the pattern
DO: Use the wedge height (measured at the widest point) as your minimum profit target, projected upward from the breakout point
DO: Check if the breakout aligns with other bullish signals like support holding or rising moving averages
DON'T: Buy the falling wedge before it breaks out just because it "looks ready to rally"—premature entries fail
DON'T: Trust breakouts on declining or weak volume—these often fail and reverse back into the wedge
DON'T: Hold through a breakdown below the lower trendline—the pattern failed and the bullish thesis is broken
DON'T: Trade falling wedges in strong bear markets where downtrend momentum overrides individual bullish patterns
Entry, Stops, and Targets
Entry strategies and risk management for falling wedge breakouts:
-
Conservative entry: Wait for the daily candle to close above the upper trendline, then enter at the open of the next session or on a pullback to the broken resistance
-
Aggressive entry: Enter on a limit order just above the upper trendline when price breaks through intraday—better price but higher failure risk
-
Stop placement: Set stop 2-3% below the lower trendline or below the most recent swing low within the wedge—if price falls back into the pattern, it failed
-
First target: Measure the height from the top of the wedge to the bottom at the widest point, project that distance up from the breakout point
-
Second target: Look for the next major resistance level above the pattern—prior swing highs, round numbers, or moving averages
-
Exit strategy: Sell half the position at first target, trail stop on remainder or hold for second target
Failure Scenarios
Falling wedge patterns fail when breakouts reverse quickly or when price breaks down instead of up. Recognizing failure signals prevents holding losing positions based on invalidated patterns.
Common failure scenarios include breakouts on low volume that immediately reverse back into the wedge within 1-2 days. This shows the breakout lacked genuine buying pressure and was likely a false move. Another failure is when price breaks above the upper trendline but can't hold, then falls back through and eventually breaks the lower trendline instead—the bullish thesis completely reversed.
Failed falling wedges often occur in strong bear markets where the broader downtrend is too powerful for individual bullish patterns to overcome. The wedge might look perfect, the breakout might even occur with decent volume, but if the market is selling off hard, the stock gets pulled down regardless. Context matters more than pattern perfection.
Watch for gaps that form during the wedge pattern—if a stock gaps down significantly within the falling wedge, it often invalidates the pattern by creating a new low that doesn't fit the converging structure. Also be wary of falling wedges that take too long to resolve—if price compresses into the apex and just sits there for weeks without breaking out, the pattern loses its relevance and often resolves with a breakdown instead of the expected breakout.
Common Mistakes and Failures


Wedge patterns fail often enough that you need to recognize the errors that turn potentially useful signals into losing trades. Most mistakes come from forcing patterns where they don't exist, ignoring context, or trading before confirmation—all avoidable with discipline and proper pattern recognition skills.
Mistakes that undermine wedge pattern trades:
-
Automatic bias: Assuming every rising wedge is a bearish reversal without checking the preceding trend—missing continuation wedges or trading against the primary trend
-
Context blindness: Ignoring what happened before the wedge formed—reversal and continuation wedges look identical but require opposite trend contexts
-
Premature entry: Entering before the breakout occurs because the pattern "looks ready"—getting stopped out when price continues moving within the wedge
-
Pattern forcing: Drawing trendlines on price action that isn't actually converging—seeing wedges where only choppy consolidation exists
-
Parallel lines: Drawing two trendlines that are parallel or barely converging—that's a channel, not a wedge
-
Insufficient touches: Using only one or two swing points to define trendlines—you need at least two touches per line, preferably three
-
Timeframe mismatch: Trading wedges that formed in just a few days on daily charts—legitimate wedges take weeks to develop
-
Volume ignorance: Not checking if volume is declining during formation or expanding on breakout—missing the key confirmation signals
-
Wrong anchor points: Placing trendlines on random candles mid-swing rather than clear swing highs and lows—produces meaningless projections
-
Breakout denial: Holding positions after clear breakout failures or breakouts in the wrong direction—refusing to accept the pattern didn't work
-
Market context override: Trading wedges while ignoring broader market conditions that fight against the pattern's implication
Why These Failures Happen
The biggest error is treating all rising wedges as bearish reversals and all falling wedges as bullish reversals without checking context. Traders learn the basic rule—rising = bearish, falling = bullish—then apply it mechanically without asking what trend preceded the wedge. This works maybe 60-70% of the time because reversal wedges are more common, but the 30-40% of continuation wedges will wreck your results if you trade them backwards.
Pattern forcing is the second most common mistake. Traders want to find wedges because they're powerful patterns, so they start drawing converging trendlines on price action that's really just moving sideways or in a channel. True wedges have both trendlines sloping in the same direction with clear convergence. If you're squinting at the chart or adjusting your trendlines multiple times to make the wedge work, it's probably not a wedge.
Entering before breakout confirmation kills otherwise good setups. You see a falling wedge at the bottom of a downtrend and think "this is definitely going to break out, I'll buy now and get a better price." Then price continues declining within the wedge for another week, stops you out, and only then breaks out after you've exited. Patience to wait for confirmation separates profitable wedge trades from premature losses.
Remember: The wedge pattern requires proper trend context to determine if it's reversal or continuation, converging trendlines with multiple touches to be valid, weeks of formation time to represent genuine exhaustion or consolidation, and breakout confirmation before entry—skipping any of these requirements turns what should be a high-probability setup into a forced trade likely to fail.
Making Wedge Patterns Work for You


Wedge patterns demonstrate why context matters more than pattern shapes in technical analysis. The same converging trendlines mean completely different things depending on what came before—rising wedges can be bearish reversals or bearish continuations, falling wedges can be bullish reversals or bullish continuations. Without checking the preceding trend, you're just gambling on geometry.
Pattern Recognition in Practice
Reversal wedges are more common and more reliable than continuation wedges, which means when you see a rising wedge after an uptrend or a falling wedge after a downtrend, the odds favor trading them as reversals. Continuation wedges exist but require stronger conviction because you're betting the wedge is a pause rather than an ending, and that's the less frequent scenario.
Patience for proper formation separates successful wedge traders from those who force patterns and enter prematurely. Legitimate wedges take weeks to develop with multiple touches on converging trendlines and declining volume toward the apex. If you're drawing trendlines after just a few days or with only one swing point per line, you're not looking at a wedge—you're seeing what you want to see. Wait for the structure to prove itself before committing capital.
The wedge pattern is one tool among many in technical analysis. When a falling wedge forms at a major support level with RSI oversold and aligns with the 200-day moving average, you have confluence that makes the bullish reversal more compelling. The wedge alone gives you a signal. The confluence with other factors gives you confidence. Trade patterns within the context of broader market structure, not in isolation where a single formation carries all the weight of your decision.


