Island Reversal (Bullish)

Bullish Reversal Pattern
A gap maroons price; a gap back flips the script. Context changes fast — execution must be simple. Respect gap integrity and act decisively.
Tobi Frenzen
Author
Tobi Frenzen
Published
August 13, 2025
Author
Tobi Frenzen
Published
Aug 13, 2025
Island Reversal (Bullish) Schematic - Bullish Reversal Pattern
Island Reversal (Bullish) Schematic - Detail View
Island Reversal (Bullish)
Bullish Reversal Pattern

Pattern Schematic

Island Reversal (Bullish)

Pattern Bias

Bullish

Pattern Type

Reversal

Consolidation

Brief

Typically Breaks

Up

Characteristics

Gap down then gap up, isolating lows.

Description

A cluster of price bars isolated by gaps on both sides; the final gap reverses direction and often triggers a swift move.

Reliability

Relies on gap integrity; quick failures if gaps fill.

Invalidation

Filling the reversal gap and closing back inside the island.

Entry

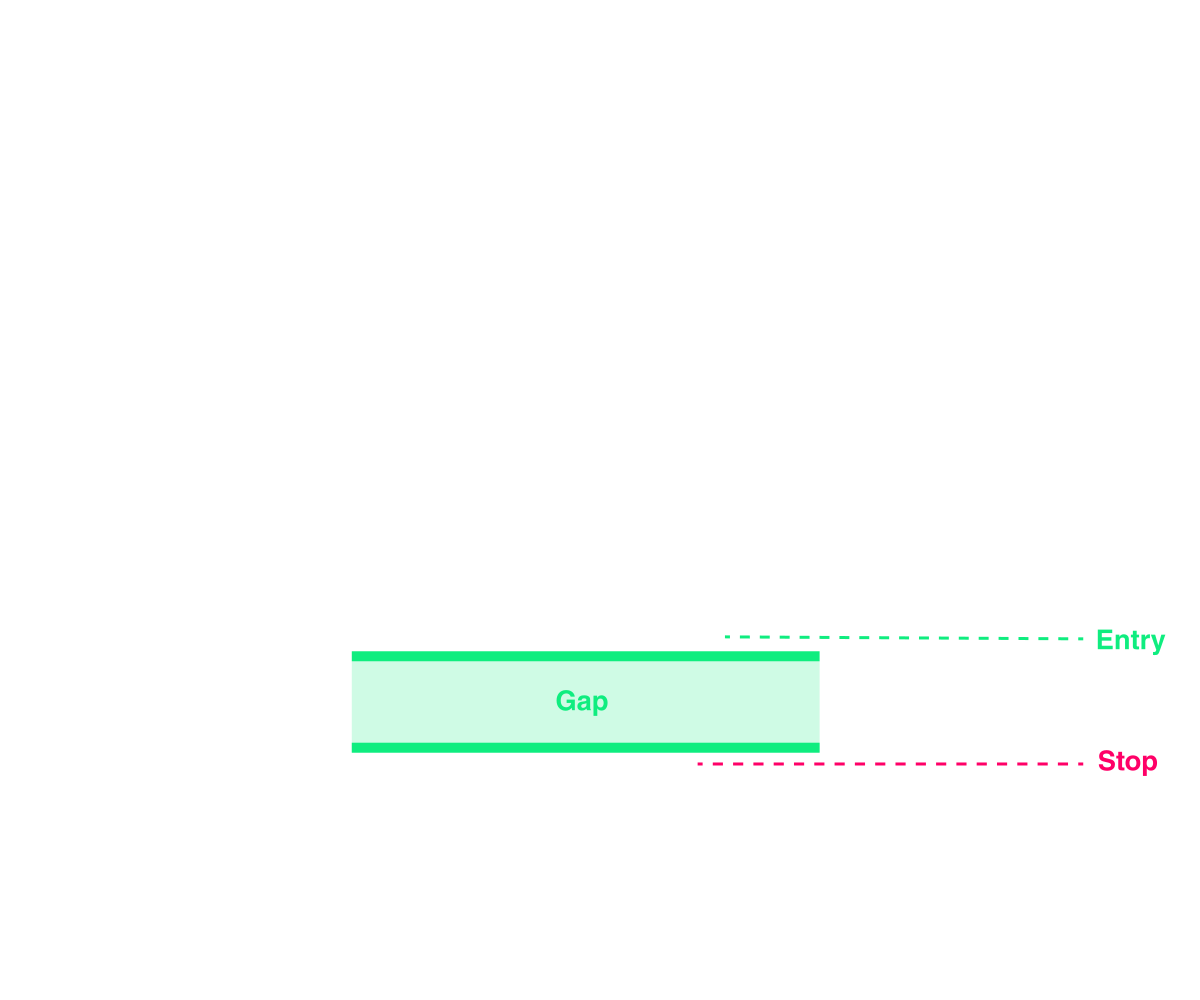
Buy on gap up that leaves island behind or on first pullback that holds the gap.

Stop

Below the gap low.

Target

Retrace back into prior range; nearby resistance for targets.

Definition & Identification

Island Reversal (Bullish)

The Island Reversal Bottom is the bullish mirror of the top, marking the end of a downtrend. It consists of:

  • Gap down: Price gaps lower, leaving a space below prior action.
  • Island consolidation: Price trades sideways at depressed levels, forming the isolated cluster.
  • Gap up: Price then gaps higher, leaving the island stranded below.

The symmetry makes the island bottom visually striking, with the island looking like a pit of despair abandoned by price.

Pattern Psychology

Island Reversal (Bullish)

The island bottom represents panic exhaustion and sudden demand resurgence:

  • Gap down: Bears dominate, often on bad news or panic. Bulls capitulate, unwilling to buy.
  • Island consolidation: Price drifts sideways at depressed levels. Bears grow overconfident, shorts add positions, while some value buyers nibble cautiously.
  • Gap up: A sudden shift (positive news, bargain demand, short squeeze) sparks buying. The gap traps shorts at poor entries, forcing them to cover.
  • Aftermath: Trapped shorts and new buyers combine to fuel sharp upward momentum.

It is the emotional mirror of the island top: despair turns to relief almost instantly.

Reliability Stats

Island Reversal (Bullish)

Bulkowski’s research indicates island bottoms are slightly more reliable than tops:

  • Upward break frequency: ~72%.
  • Failure rate: ~9%.
  • Average rise after breakout: ~30%.
  • Duration of island: 3–10 sessions typical.
  • Volume signature: Gaps occur with heavy volume surges.

Though rare, the island bottom is a strong bullish reversal when confirmed.

Trade Plan

Island Reversal (Bullish)

Entry:

  • Conservative: Enter long after the gap up is confirmed (close above gap).
  • Aggressive: Buy immediately on the open after the gap up.

Stop loss: Below the bottom of the island (conservative) or just under the gap itself (aggressive).

Targets: Minimum = height of the island projected upward. Secondary = prior resistance zones.

Invalidation: If price closes back into the gap, the pattern is invalidated.

Nuances & Common Traps

Island Reversal (Bullish)
  • Gap fills: Sometimes price fills the gap up quickly, negating the reversal.
  • Context matters: More reliable after extended declines, especially with panic selling.
  • Duration: Long “islands” risk being consolidations, not true reversals.
  • Market type: More common in equities than forex/crypto, since gaps are less frequent in continuous trading.
  • Volume confirmation: Without heavy volume, reversals often fade.

When to Skip

Island Reversal (Bullish)
  • If volume doesn’t confirm the gap up.
  • If the pattern forms mid-range rather than after a sustained downtrend.
  • If price fills the gap immediately afterward.
  • If broader market remains strongly bearish.
Island Reversal (Bullish) Summary
Island Reversal (Bullish)

Summary

The Island Reversal Bottom is a bullish reversal that breaks upward ~72% of the time with ~30% average gains. It reflects exhaustion of selling pressure followed by sudden bullish demand, trapping shorts. Best results occur after prolonged declines, with both gaps confirmed on strong volume.

Join The
Chart Guys!

To learn from other experienced traders and technical analysts, why not join our unique trading community? We can't wait to welcome you in our trading room to answer your questions and help you achieve your goals.
Follow Us On Social Media