Double Top (M)

Bearish Reversal Pattern
Two pushes into resistance, then gravity. The midpoint isn’t magic — just clarity. Trade the decision and avoid the drama; focus on execution, not hindsight.
Tobi Frenzen
Author
Tobi Frenzen
Published
August 13, 2025
Author
Tobi Frenzen
Published
Aug 13, 2025
Double Top (M) Schematic - Bearish Reversal Pattern
Double Top (M) Schematic - Detail View
Double Top (M)
Bearish Reversal Pattern

Pattern Schematic

Double Top (M)

Pattern Bias

Bearish

Pattern Type

Reversal

Consolidation

Yes

Typically Breaks

Down

Characteristics

Two similar highs; confirm on trough-between breakdown.

Description

Two comparable peaks separated by a pullback; confirmation comes on a break of the intervening low.

Reliability

Better if second high is weaker or shows bearish divergence.

Invalidation

Reclaim above the second peak after breakdown.

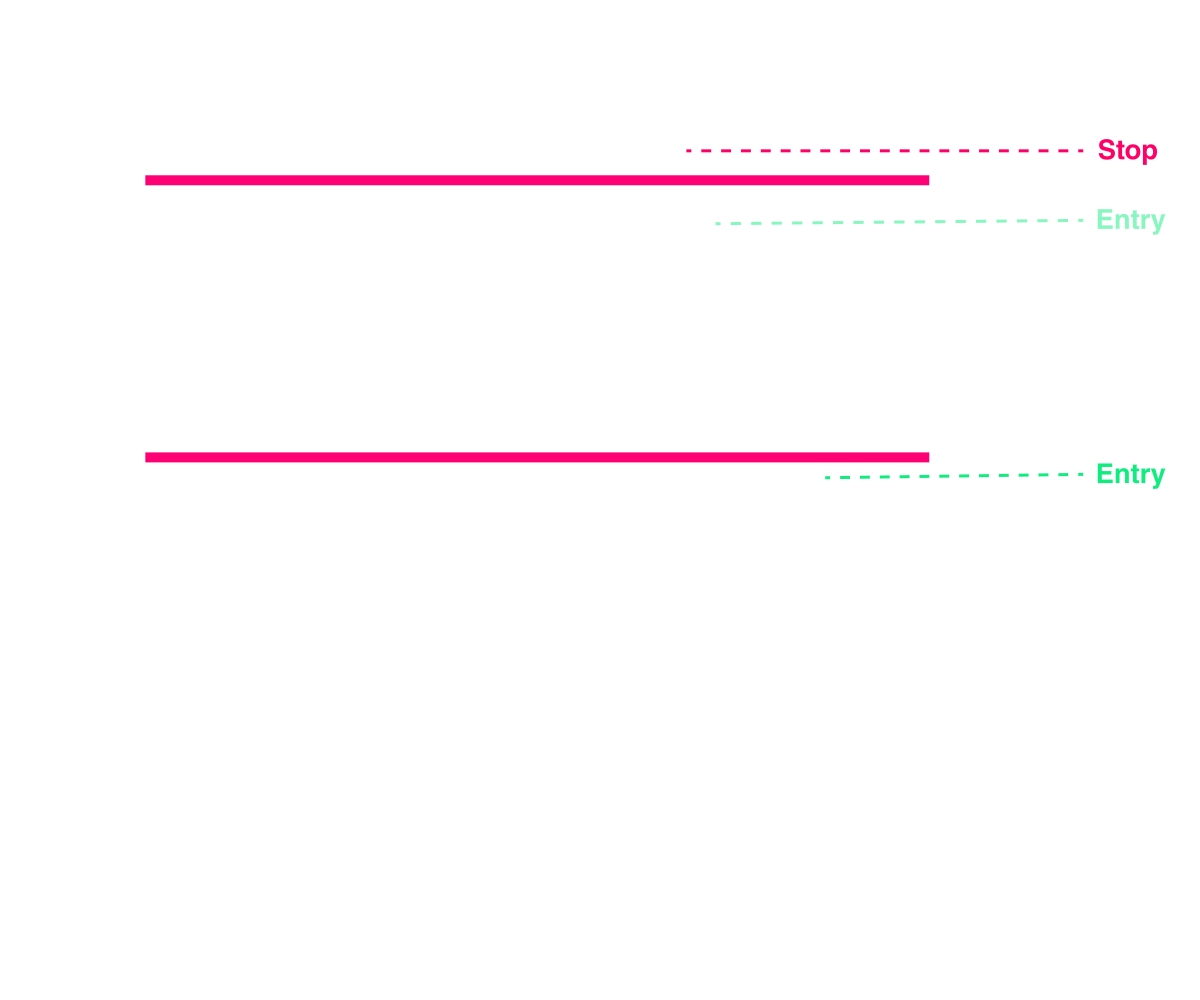
Entry

Close below the middle trough; add on throwback failure.

Stop

Above second peak.

Target

Subtract height from highs to intervening low from breakdown.

Definition & Identification

Double Top (M)

The Double Top is a bearish reversal pattern that signals a potential end to an uptrend. It consists of:

  • Two prominent peaks at roughly the same price level, separated by a trough.
  • A neckline (support level) formed at the lowest point between the two peaks.
  • Volume usually declines on the second peak.
  • Confirmation comes when price breaks below the neckline with volume.

Visually, it resembles the letter M, with two highs and a breakdown below support.

Pattern Psychology

Double Top (M)

The double top captures the shift from bullish control to bearish dominance:

  • The first peak reflects strong demand driving prices higher.
  • A pullback follows as profit-taking occurs.
  • Buyers return to test the prior high, but this second rally meets strong resistance — sellers overwhelm buyers at the same price level.
  • The failure to surpass the first peak erodes confidence, especially as volume wanes.
  • When the neckline breaks, buyers who entered on the second rally are trapped, adding fuel to the selloff as stops are triggered.

This psychology makes the double top one of the most recognizable and emotionally charged reversal setups.

Reliability Stats

Double Top (M)

Bulkowski’s large-scale studies highlight the double top’s effectiveness:

  • Breakout direction: ~65% downward.
  • Failure rate: ~17% (price rallies back above peaks).
  • Average decline after breakdown: ~20%.
  • Pullback (retest of neckline): ~65%.
  • Target met rate: ~64%.

The pattern works best when the two peaks are distinct (separated by weeks, not days), and when volume declines on the second peak.

Trade Plan

Double Top (M)

Entry: Short when price closes below the neckline. Aggressive traders may enter early on weakness at the second peak, but confirmation is safer.

Stop loss: Above the second peak (conservative) or above neckline retest (aggressive).

Targets: Minimum = distance between peak and neckline projected downward. Secondary = major support zones or Fibonacci levels.

Invalidation: A sustained break above the second peak invalidates the setup.

Nuances & Common Traps

Double Top (M)
  • Time between peaks: Too short (a few candles) reduces reliability; best setups span weeks.
  • Volume divergence: Declining volume on the second peak improves odds; rising volume reduces reliability.
  • Throwbacks: Price often retests the neckline after breakdown.
  • Overextended uptrends: A double top at the end of a parabolic run may lead to sharper-than-average declines.
  • False breakdowns: Sometimes price dips below the neckline then quickly recovers, trapping shorts.

When to Skip

Double Top (M)
  • If the two peaks are not at similar levels — pattern may be invalid.
  • If overall market trend is strongly bullish, which can override the local reversal.
  • If the neckline is sloping upward strongly — less bearish implication.
  • If the pattern forms in very short timeframes with little volume data.
Double Top (M) Summary
Double Top (M)

Summary

The Double Top is a bearish reversal formation that breaks downward ~65% of the time with ~20% average declines. It reflects failure to overcome resistance twice and a loss of bullish momentum. Traders should wait for neckline confirmation, manage stops carefully, and expect frequent retests.

Join The
Chart Guys!

To learn from other experienced traders and technical analysts, why not join our unique trading community? We can't wait to welcome you in our trading room to answer your questions and help you achieve your goals.
Follow Us On Social Media