
The Chart Guys' SuperStack indicator is a proprietary premium tool designed to identify potential market reversal points by analyzing up to nine major timeframes simultaneously.
The SuperStack excels in pinpointing likely inflection points, providing traders with timely signals to plan and execute trades before market trends shift. By monitoring multiple timeframes, the SuperStack indicator consolidates this data to highlight moments when a price move is most likely to reverse, aiding both day traders and swing traders in making informed decisions without constantly having to switch between timeframes.
Great signal for when price action gets extreme

Thank you for making this available
Essential part of my trading toolkit
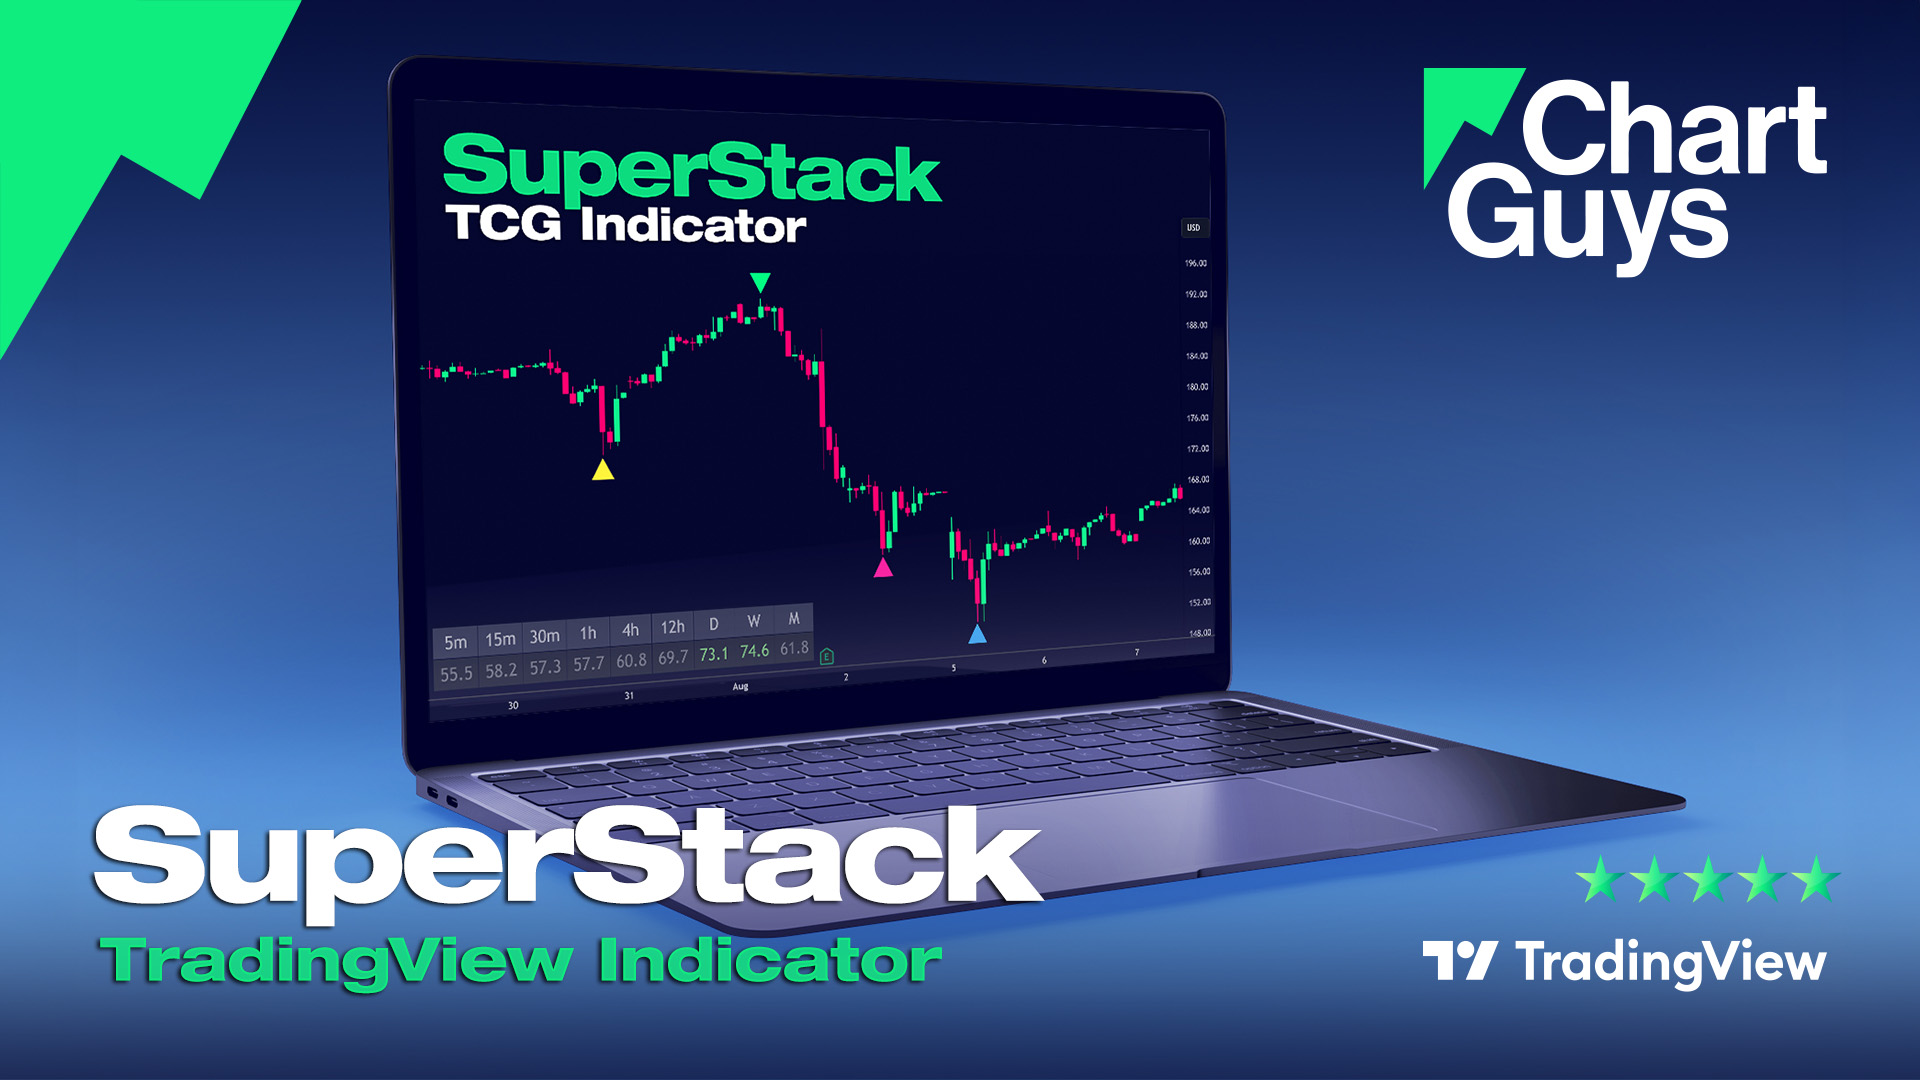
What is the SuperStack Indicator?

The SuperStack is an RSI-based indicator designed for both day trading and swing trading under general market conditions. It consists of two key components:
- SuperStack Labels: The indicator plots labels on your chart to indicate when a SuperStack alignment on the current and all lower timeframes occurs.
- Multi-TF RSI Heatmap: A unique heatmap allows you to quickly "take the temperature" of your ticker across all major timeframes, reducing your need to switch between them.
TradingView Indicator
SuperStack
Lifetime Access
Automatic Updates
Made for TradingView
Real-Time Alerts
Real-Time Data Advisory for Stock Exchanges
Case Studies
See the SuperStack Indicator in action...

XAUUSD
During October 2025, Gold spot trended steadily higher with brief consolidations and higher highs. The SuperStack indicator gave advance notice of extreme conditions and marked three local tops along the way. The first top printed after a strong breakout and was followed by a measured ~2% pullback before buyers regained control. The second signal triggered into strength along the higher highs and produced a deeper ~3% correction to reset the momentum.
Heading into the final leg, the hype around metals turned up a notch as the price advance accelerated and a third monthly SuperStack printed just before rolling over into a sharp ~4% decline. Price then rebound to retest the prior highs. This retest failed in a classic Double Top formation, with bears stepping in and unleashing the largest decline of the move of 8%+ from the prior highs, confirming a clear momentum shift and retracing most of the prior week's gains.

DJT
The DJT stock price entered a prolonged downtrend from mid-July to late September 2024, due to widespread sentiment that the stock was overvalued and overconfidence among short-sellers. The accompanying chart (Daily SuperStack Oversold, with lower timeframe signals hidden for clarity and shown on a 4-hour chart) shows a signal triggering at $12.08 on September 23, 2024. This signal indicated that all major timeframes, including Daily, 12hr, 4hr, 1hr, 30min, 15min, and 5min, were simultaneously in extreme oversold conditions, greatly increasing the odds of at least a temporary reversal. After sellers failed to push the price much lower at the open on September 24, this marked the bottom, sparking a significant rally. This rally culminated in a short-squeeze, peaking on October 29, 2024, when the stock briefly reached $57.50 during pre-market hours—a gain of over 350%—before sharply reversing lower.

ANF
ANF experienced an extraordinary bull run, achieving gains of thousands of percent over a brief two-year period during a blue-sky breakout. After the peak of euphoria, the stock underwent its most significant selloff of the entire run, culminating in two consecutive gap downs that led into a daily SuperStack of oversold conditions. In the following three weeks, bullish traders witnessed a 42% bounce before the stock established an inevitable weekly lower high.
The key factor was that the longer-term monthly trend remained bullish, with a higher low being the most probable scenario. Meanwhile, the shorter-term time frames were all aligning in extreme oversold conditions, giving traders confidence in at least a short-term bounce to cool off RSI levels and allow for positioning.