


The Morning Volume Surge indicator offers a focused lens on early-session activity where many meaningful moves begin. By detecting when volume behavior shifts away from the norm in the minutes after the open, it helps traders spot momentum and participation build in real time, before it becomes obvious.
For traders looking to sharpen their timing, this tool adds a layer of objectivity that’s often missing in the rush of the open. Whether you’re building a new strategy or fine-tuning an existing one, MVS helps you stay selective and act with more confidence when early strength actually means something.
What is the Morning Volume Surge Indicator?
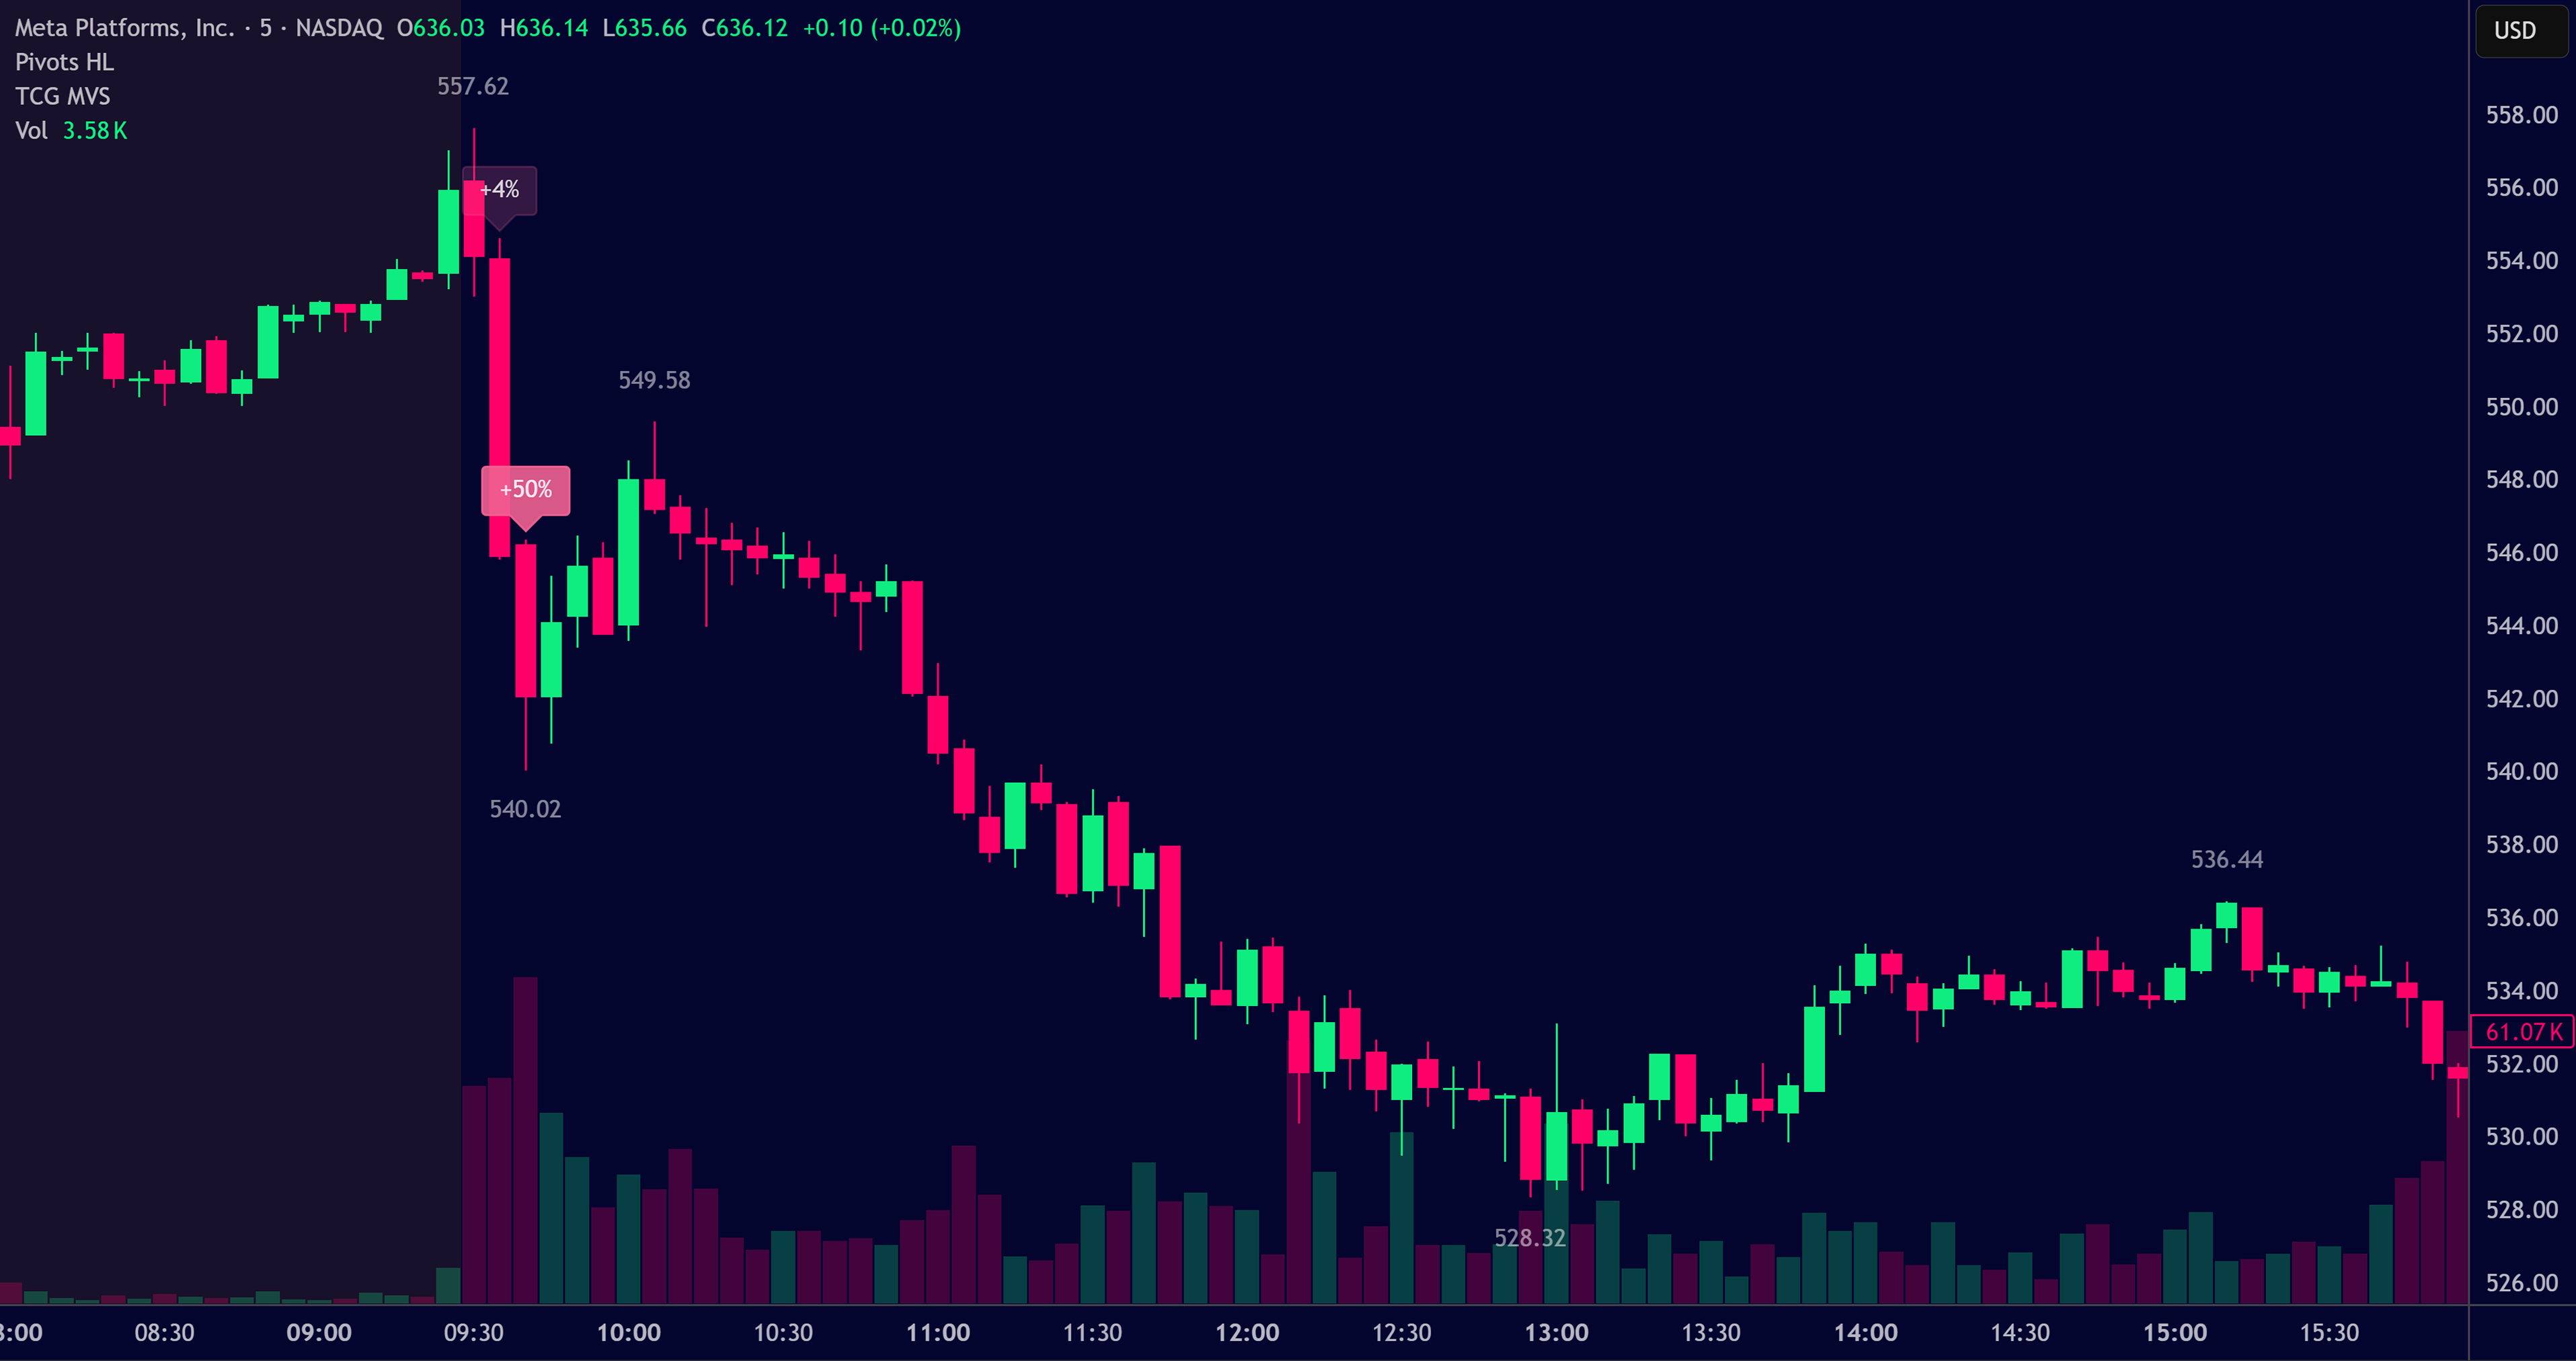
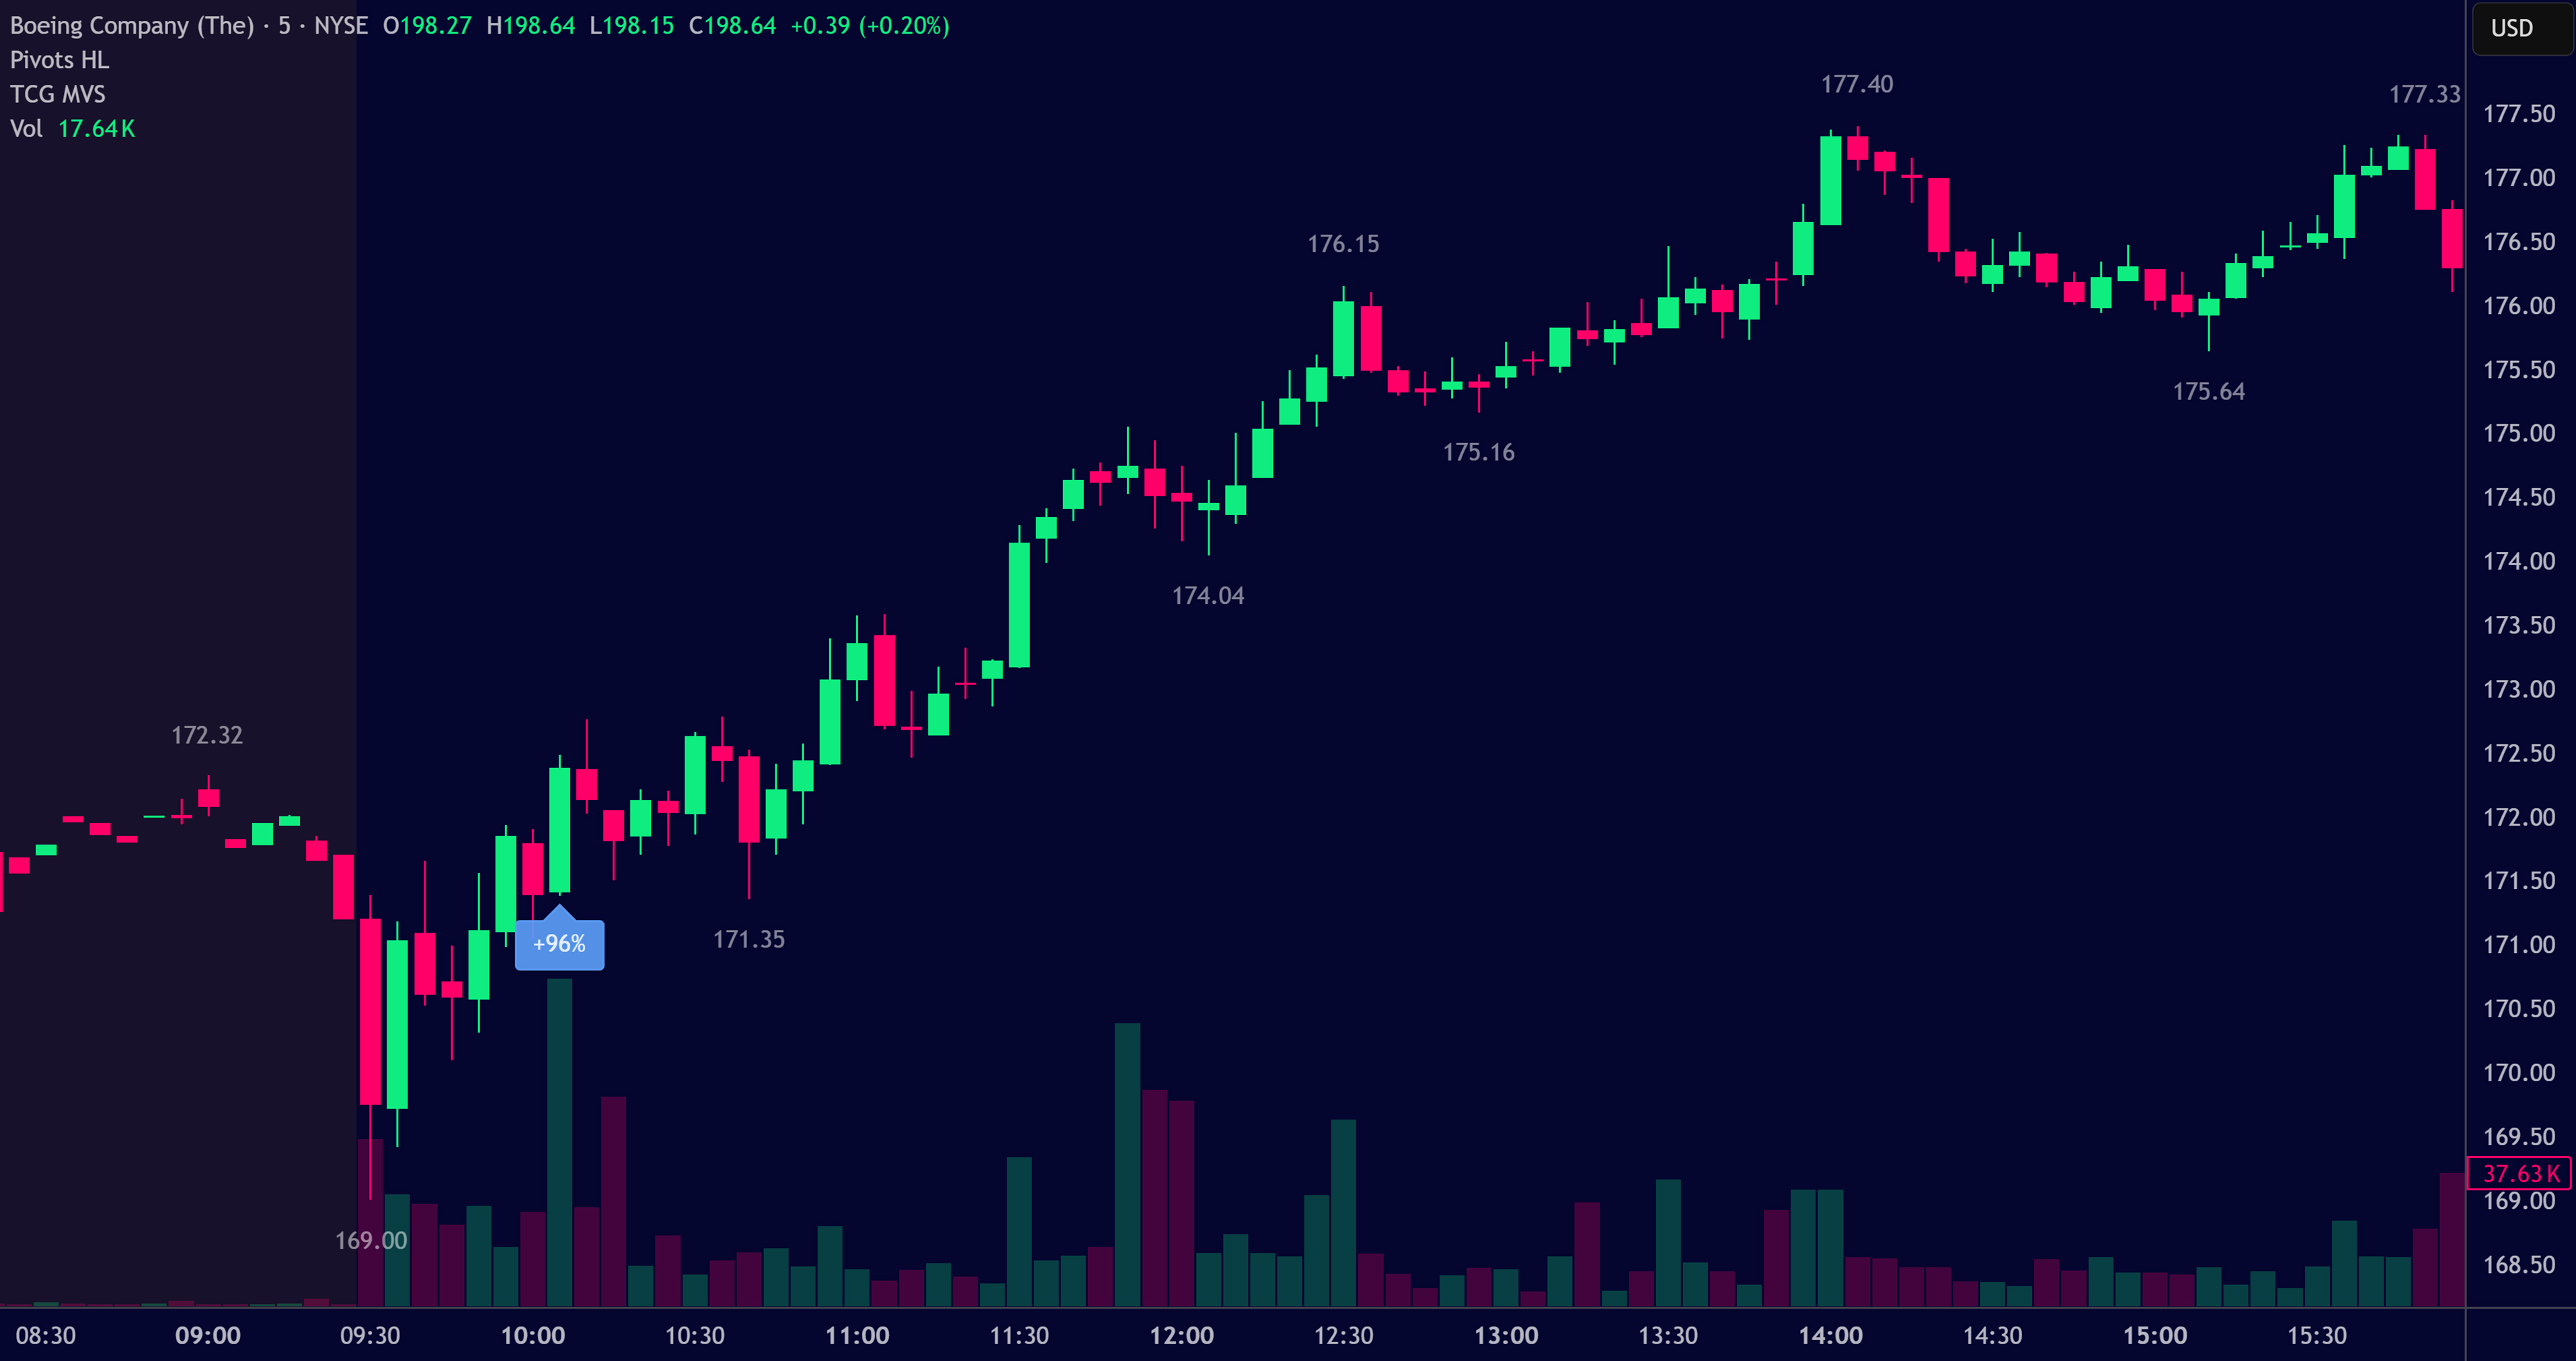
The MVS identifies setups where the opening candle is NOT the volume leader — a subtle but significant deviation from typical behavior. In well-structured names, the open usually sees the highest 5-minute volume of the session. When that pattern breaks, and volume accelerates in a later candle, it often signals the beginning of a trending move.
The indicator monitors this for 12 candles after the open (user-adjustable), and triggers up to three customizable alerts per session when volume exceeds predefined thresholds (e.g. +1%, +10%, +25%). Labels and alerts are color-coded by trend direction and volume intensity, helping traders visually assess the quality of each signal in real time.
Ideal Setup Criteria
- The ticker rarely exceeds the opening volume later in the morning (e.g. once every few weeks)
- The move is not driven by news, earnings, or a major headline
- The stock is not already extended before the signal fires (avoid gap-and-go or volume climax setups)
- The stock is not an ADR (commonly misrepresents morning volume; popular ADRs like BABA, JD, NIO are auto-excluded)
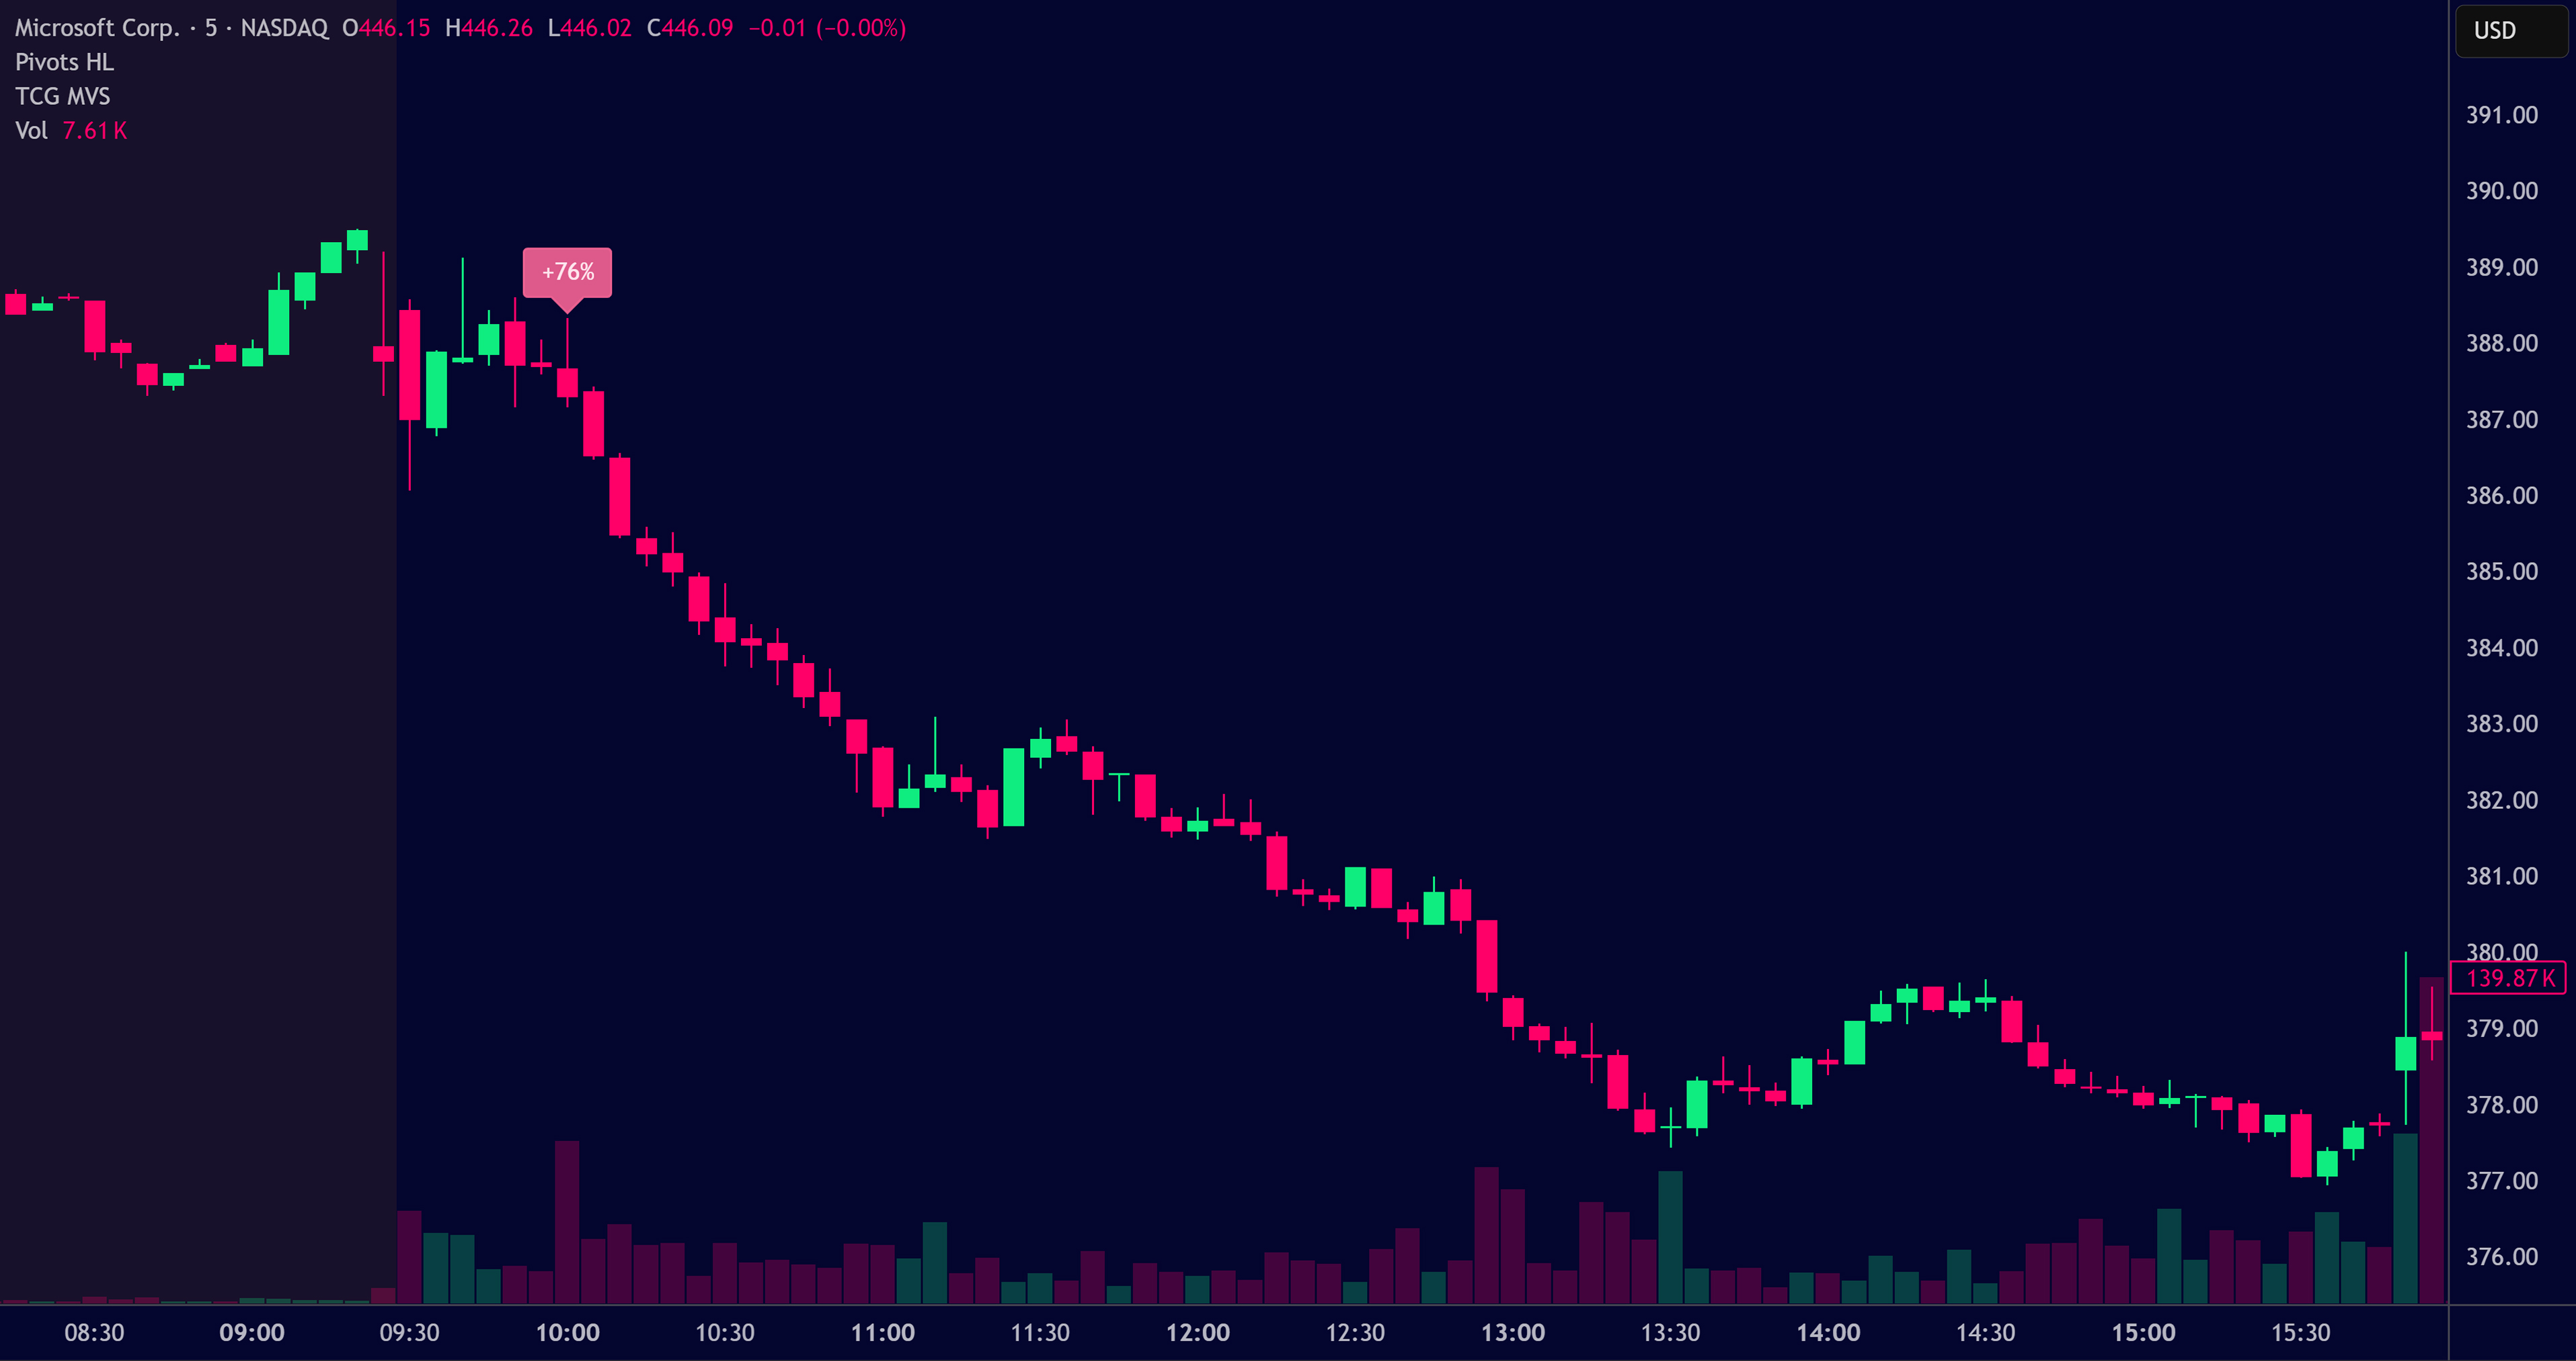
MVS signals are aggressive entry signals, and trades often require market orders with risk defined by a fixed dollar amount rather than a nearby support level. Partial exits into strength are recommended to manage cost basis and control risk.
Traders should pay attention to context — signal quality improves when broader market structure, sector trends, and price action align with the surge.
It is not intended as a standalone system, but rather as a timing tool within a well-defined trading plan. The strongest signals tend to occur on clean daily charts, with tight consolidation followed by a clear surge in volume and price.
⚠️ Real-Time Exchange Data Requirement
The Morning Volume Surge indicator is specifically optimized for major U.S. stocks traded on the NYSE and NASDAQ exchanges.
Please note that although TradingView offers free access to many U.S. stocks via the BATS (Cboe) exchange, this data reflects only a small portion of the total trading volume — specifically, the trades that occur on BATS itself. Using the indicator on this data feed does not provide a full picture of overall market activity, which can lead to misleading signals.
While the indicator may give good results when used on other markets or instruments, for the most accurate and reliable volume signals in keeping with the Morning Volume Surge Strategy, a premium real-time data subscription to both NYSE and NASDAQ is strongly recommended for U.S. stocks, which is available via TradingView for a small monthly fee.

To help ensure signal integrity, the indicator is configured by default to exclude:
- Non-stock tickers (e.g. indices, ETFs, cryptocurrencies)
- Stock tickers using the BATS exchange feed
- Popular ADRs (American Depositary Receipts), which often have fragmented or less reliable volume data
When such exclusions are applied, the indicator displays an on-chart informational label. All of these default behaviors can be adjusted within the indicator's settings panel to suit your specific use case.
TradingView Indicator
Morning Volume Surge
Lifetime Access
Automatic Updates

Made for TradingView
Real-Time Alerts
Real-Time Data Advisory for Stock Exchanges
Case Studies
See the Morning Volume Surge Indicator in action...
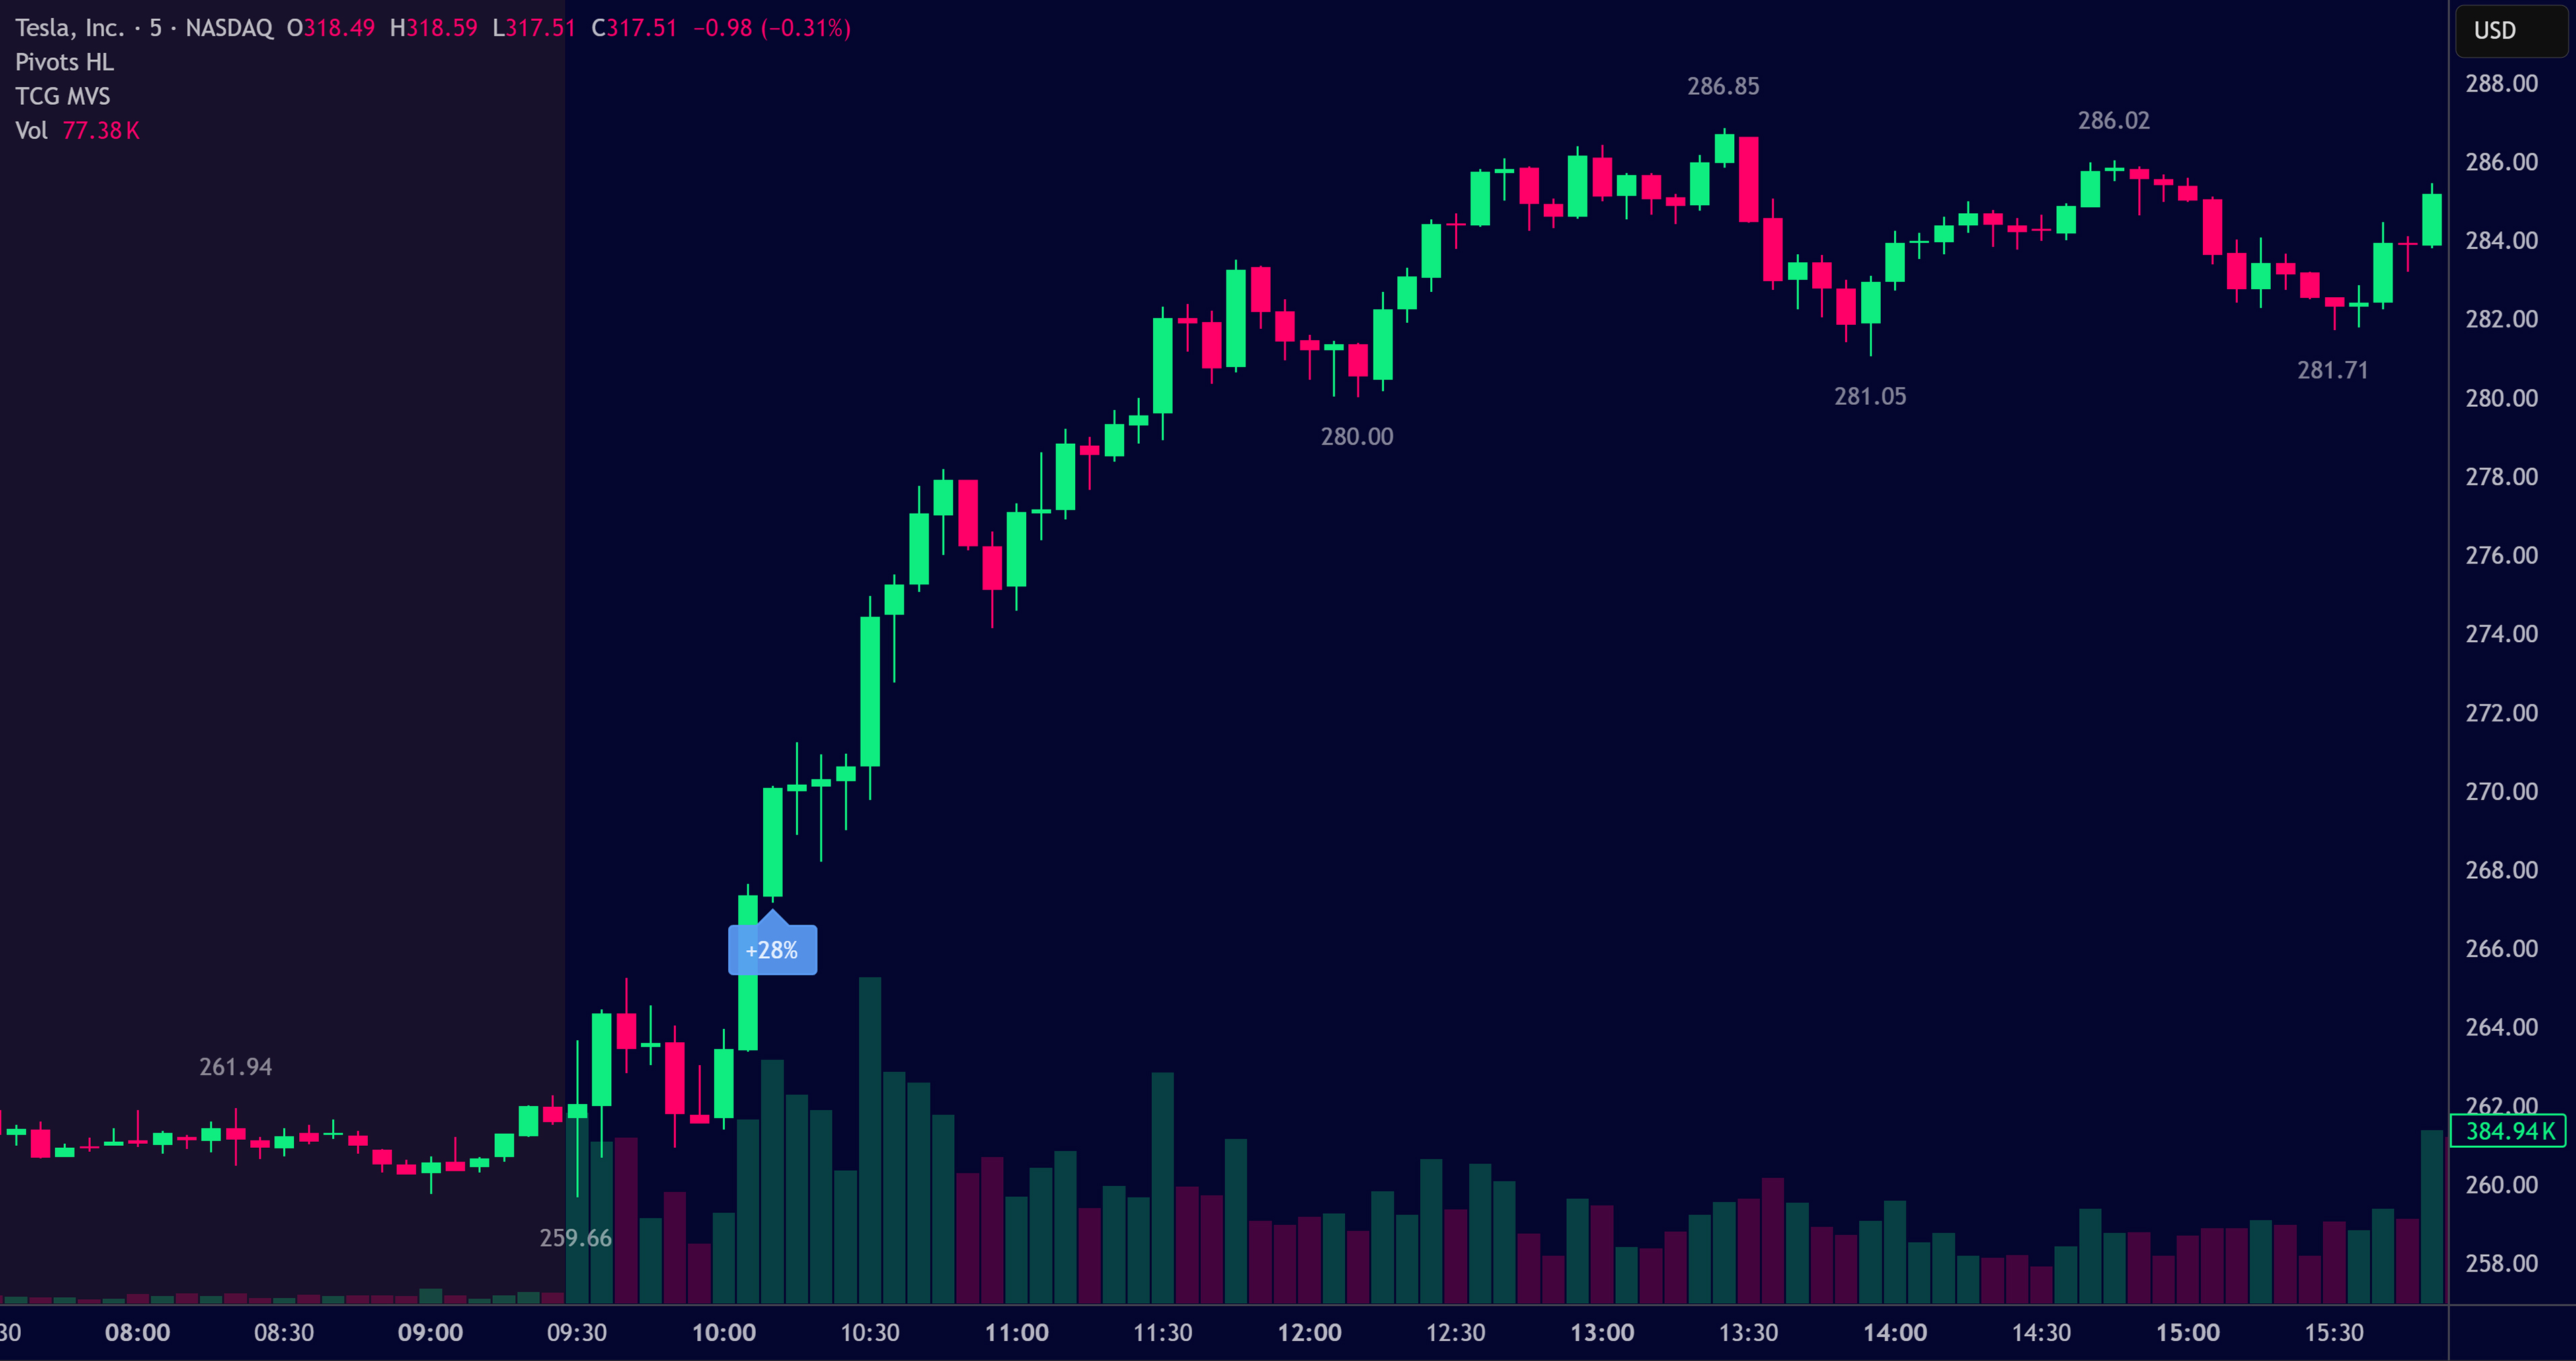
TSLA
TSLA triggered the Morning Volume Surge indicator on Friday, April 25th, during the 8th five-minute candle of the trading session. At that moment, the stock had just confirmed a five-minute uptrend into a new high of the day, after demonstrating relative strength compared to QQQ in both the pre-market and through the opening minutes of regular trading. From that point forward, the bulls maintained the five-minute uptrend for the next 90 minutes, delivering an additional +5% of follow-through and ultimately reaching over a 6% gain from the signal to the high of the day. An aggressive bull operating in a strong market environment would typically look to take partial profits into the initial 1–2% of follow-through in order to lower their cost basis and remain in full control of the trade for the remainder of the day.
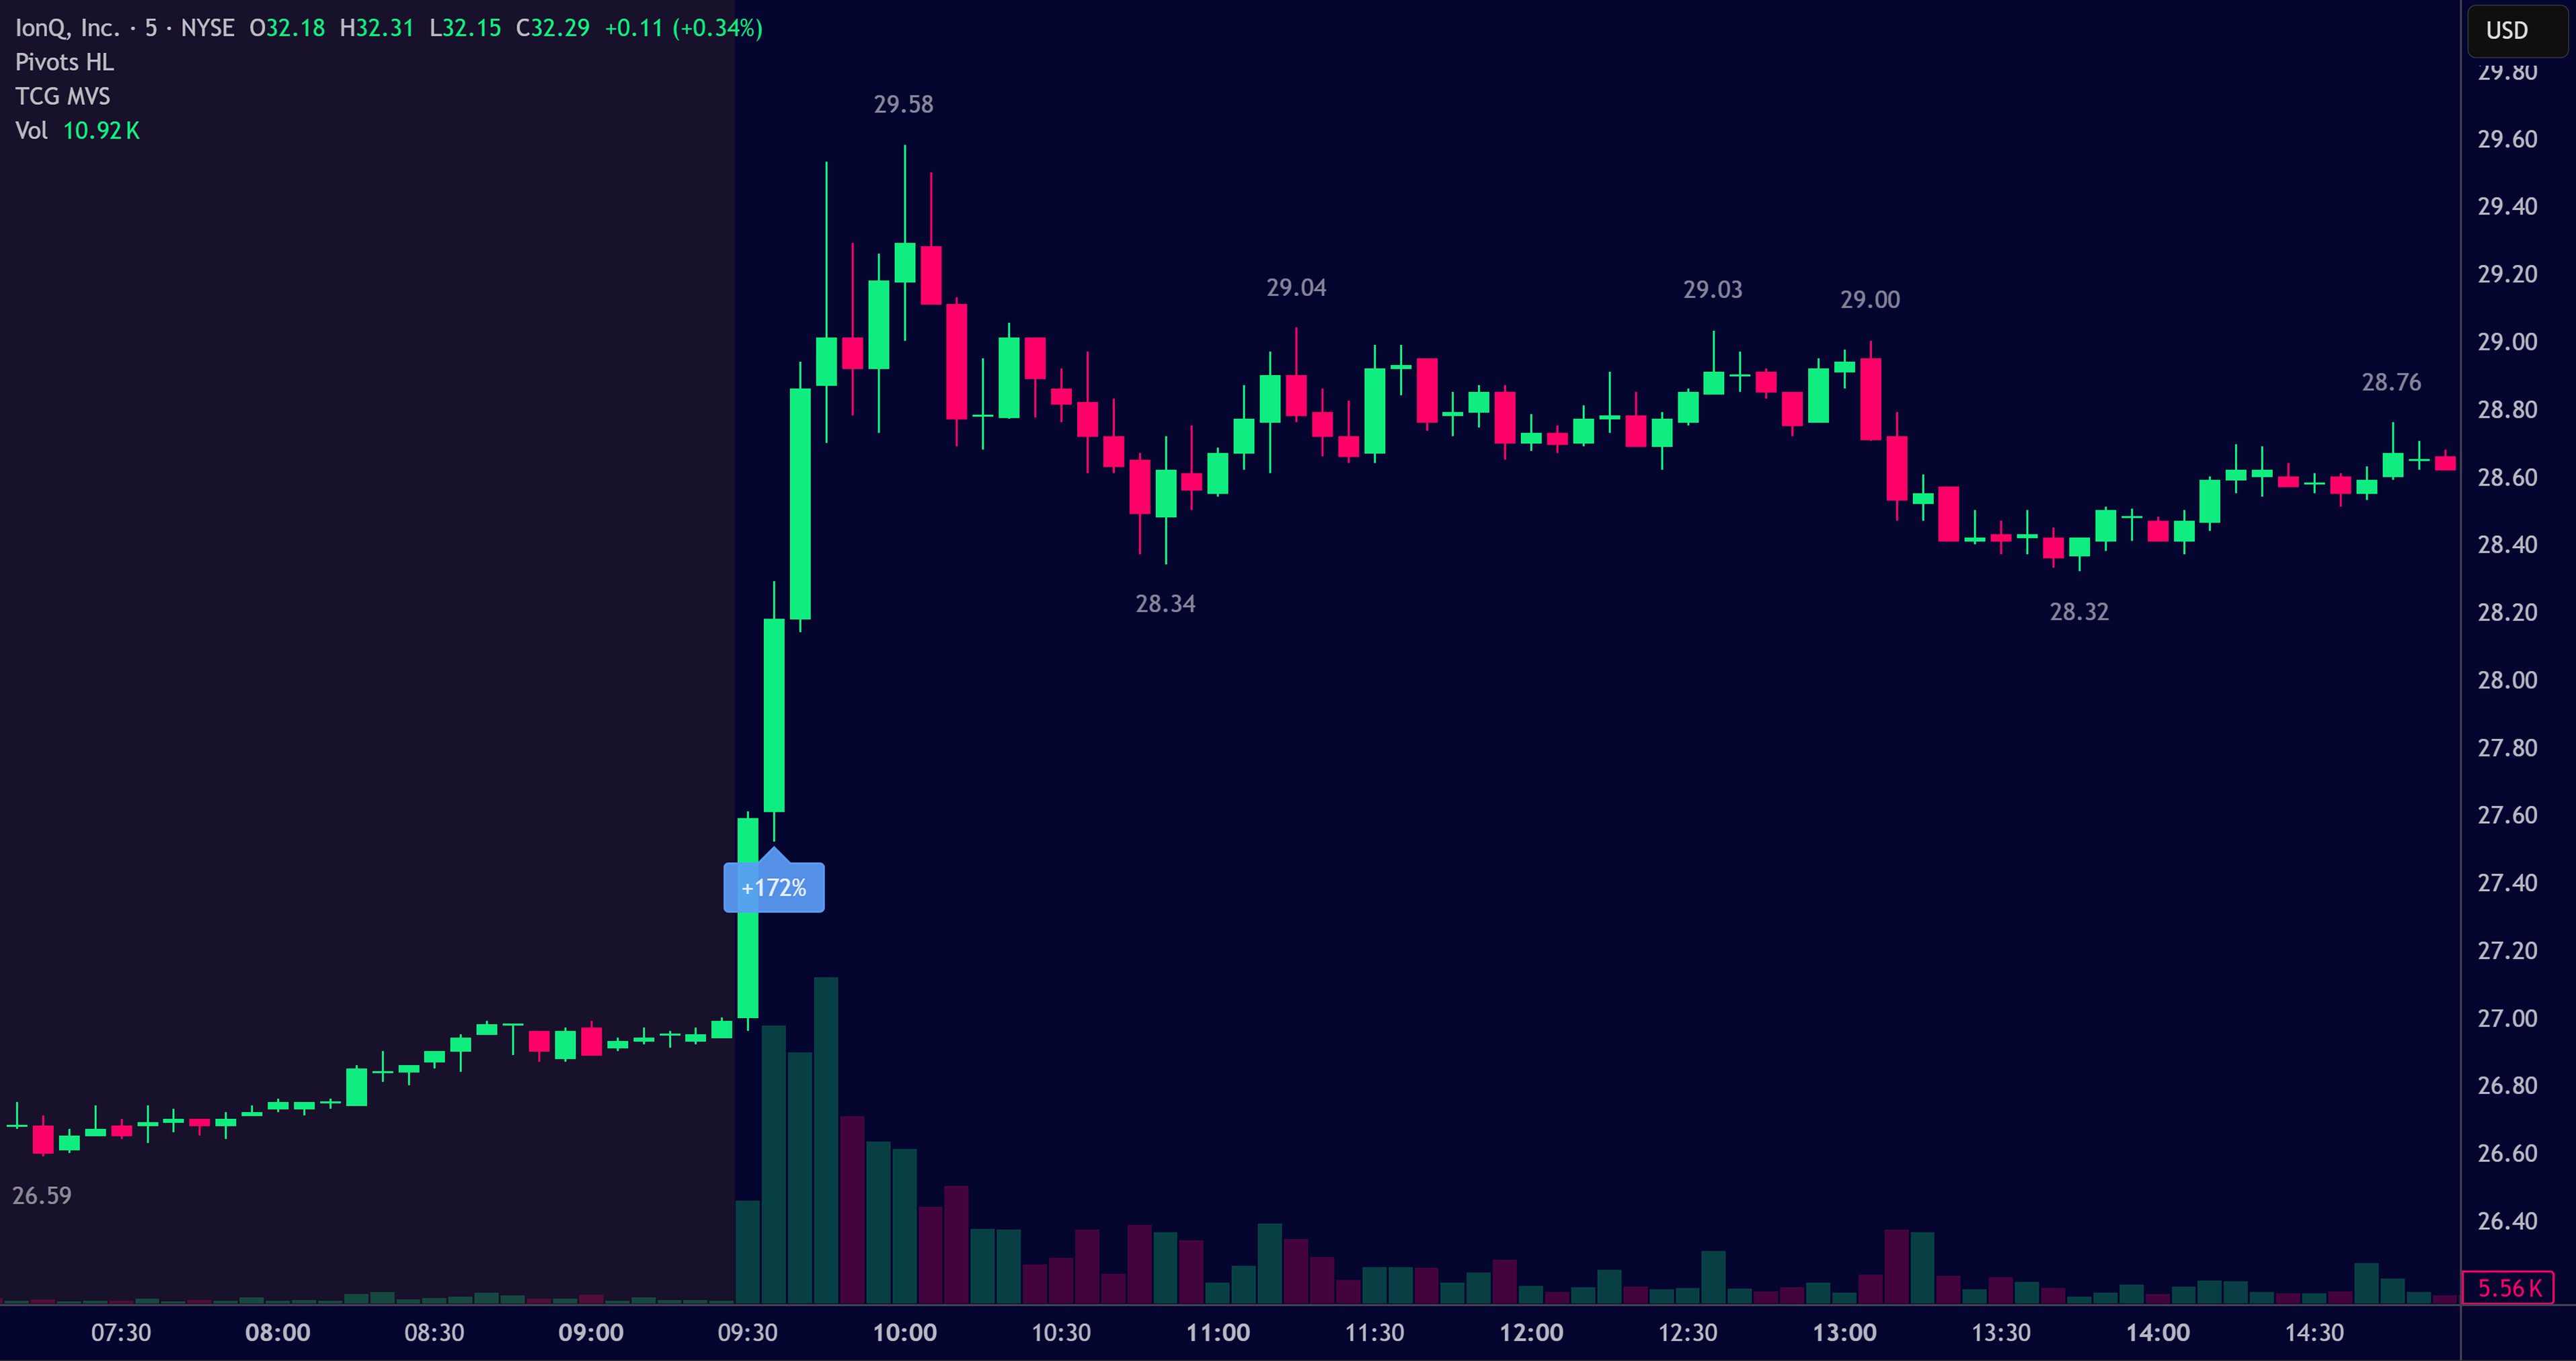
IONQ
IONQ triggered the Morning Volume Surge Indicator on Thursday, April 24th, during the second five-minute candle of the session. From there, the stock delivered an additional +4% of follow-through before the five-minute stair-step pattern eventually broke. There wasn’t much continuation beyond that move for the remainder of the day, so a trader who entered on the signal and scaled out partially into the initial follow-through would likely look to exit the remaining runner position during the afternoon session.
It's worth noting that IONQ triggered the indicator again the following day, Friday, April 25th. However, this is an example of a signal we would choose to skip, as it came immediately following a news halt and was already extremely extended within a short time frame, making it far too risky to chase. As a rule, our ideal setups exclude the influence of breaking news, favoring organic volume surges instead.

TSLA
On Thursday 11th and again on Friday 12th of September 2025, Tesla had back-to-back monster days. Both were flagged by our Morning Volume Surge (MVS) indicator which is a signal that tells us when intraday volume is behaving unusually.
Normally, the first 5-minute candle has the heaviest volume of the session. When that isn’t the case, and volume picks up later, it’s a heads-up that something out of the ordinary is happening. The direction of that surge often points to continuation.
On Thursday, TSLA triggered about 40 minutes into the session, already 2% off the lows and still ripped another $12 higher. Friday, the same thing: a late signal, but again continuation. The key intraday moment? A 5-minute pullback where bulls defended support by just a few cents. That higher low held, and from there it was a trending day. Break support and we consolidate. Hold it, and bulls run the table. That’s the power of spotting unusual volume and respecting support levels in real time.