Head & Shoulders (Complex)

Bearish Reversal Pattern
Tops aren’t always tidy. Extra shoulders, uneven symmetry — same lesson: wait for proof. The neckline and retest do the heavy lifting.
Tobi Frenzen
Author
Tobi Frenzen
Published
August 13, 2025
Author
Tobi Frenzen
Published
Aug 13, 2025
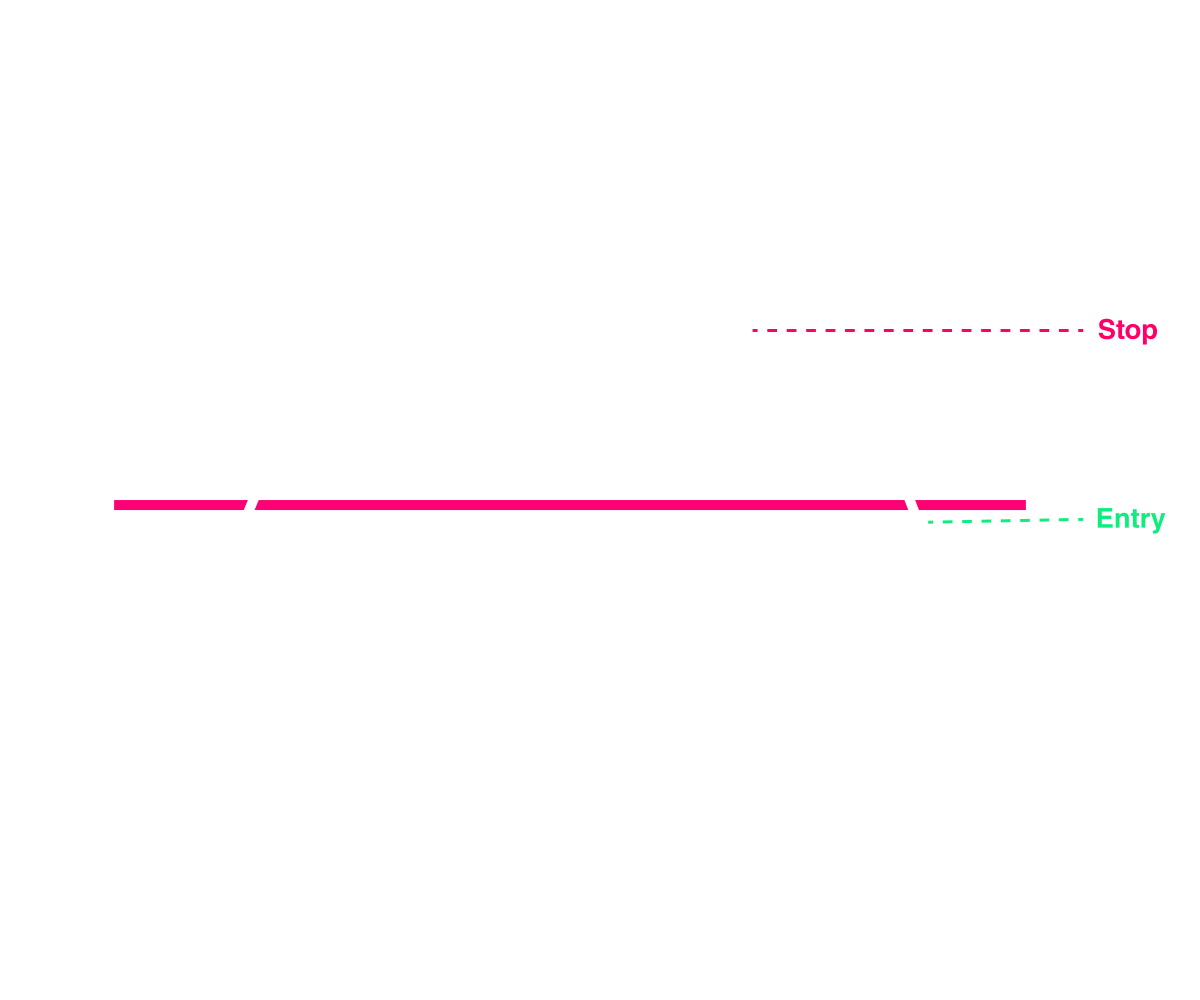
Head & Shoulders (Complex) Schematic - Bearish Reversal Pattern
Head & Shoulders (Complex) Schematic - Detail View
Head & Shoulders (Complex)
Bearish Reversal Pattern

Pattern Schematic

Head & Shoulders (Complex)

Pattern Bias

Bearish

Pattern Type

Reversal

Consolidation

Prolonged

Typically Breaks

Down

Characteristics

Multiple shoulders / uneven structure.

Description

A more irregular topping pattern with extra shoulders; the same neckline principle applies.

Reliability

Choppy; demand decisive neckline break to reduce whipsaws.

Invalidation

Sustained reclaim above neckline and right-side highs.

Entry

Close below neckline; entries on failed retest.

Stop

Above highest right-side shoulder.

Target

Subtract head-to-neckline distance from breakdown.

Definition & Identification

Head & Shoulders (Complex)

The Complex Head & Shoulders Top is a variation of the standard pattern where:

  • Multiple shoulders form on one or both sides of the head.
  • The head still marks the highest peak.
  • A neckline connects the troughs.
  • Breakdown occurs once price closes below neckline support.

This version arises when distribution takes longer, producing extra fluctuations before reversal.

Pattern Psychology

Head & Shoulders (Complex)

The psychology is similar but extended:

  • Bulls continue to attempt rallies, producing extra shoulders, but cannot sustain new highs.
  • Each rejection at resistance reinforces seller strength.
  • The elongated formation shows prolonged distribution, with institutions gradually offloading positions.
  • Once neckline breaks, bearish conviction surges as longs capitulate.

Reliability Stats

Head & Shoulders (Complex)

Bulkowski’s data shows:

  • Downward breakout frequency: ~64%.
  • Failure rate: ~15%.
  • Average decline: ~21%.
  • Pullback frequency: ~56%.
  • Target met rate: ~65%.

Complex variations are slightly less reliable due to noise, but still effective.

Trade Plan

Head & Shoulders (Complex)

Entry: Short on confirmed neckline break. Early entries during shoulder formation are risky.

Stop loss: Above the last right shoulder or head.

Targets: Head-to-neckline distance projected downward. Secondary = nearby supports.

Invalidation: Sustained breakout above the head cancels setup.

Nuances & Common Traps

Head & Shoulders (Complex)
  • False perception: Traders sometimes confuse normal consolidation with complex shoulders.
  • Duration: Complex versions take longer to form, which can frustrate early entries.
  • Volume pattern: Should mirror the standard H&S — declining into shoulders, surge on breakdown.

When to Skip

Head & Shoulders (Complex)
  • If the structure drags out too long and morphs into a rectangle.
  • If neckline slope is steeply upward.
  • If breakout lacks conviction volume.
Head & Shoulders (Complex) Summary
Head & Shoulders (Complex)

Summary

The Complex Head & Shoulders Top is a bearish reversal with extra shoulders before breakdown. It breaks down ~64% of the time, averaging ~21% declines. It represents prolonged distribution but requires patience and volume confirmation.

Join The
Chart Guys!

To learn from other experienced traders and technical analysts, why not join our unique trading community? We can't wait to welcome you in our trading room to answer your questions and help you achieve your goals.
Follow Us On Social Media