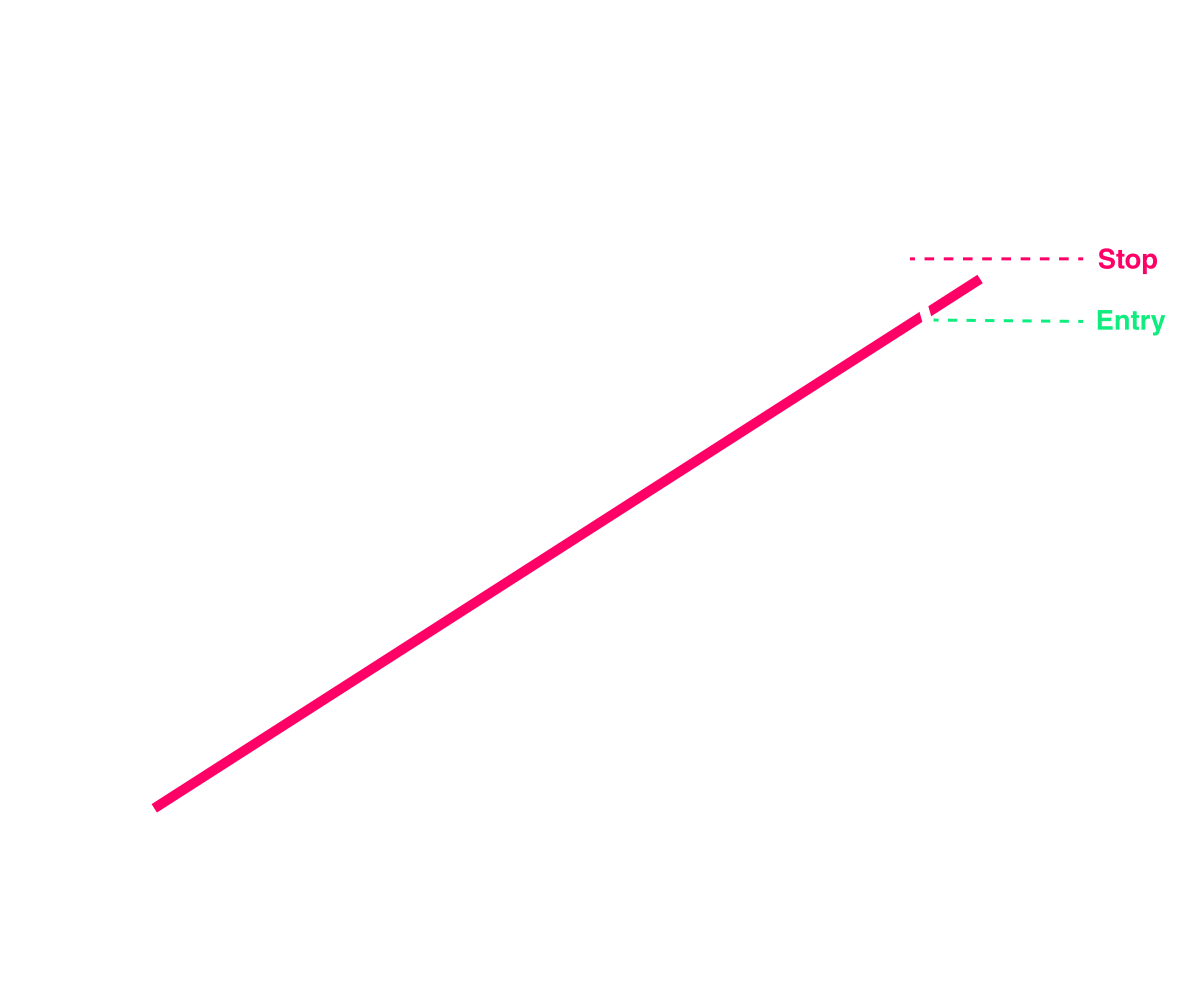
Bump-and-Run Reversal (Bearish)
Definition & Identification
The Bump-and-Run Reversal Top (BARR Top) is a bearish reversal pattern described in detail by Thomas Bulkowski. It develops in two distinct phases:
- Lead-in phase: Price trends steadily higher along a modestly sloped support line. The move is orderly, sustainable, and supported by average volume.
- Bump phase: Price suddenly accelerates above the trendline, steepening its slope dramatically. Volume often surges. The bump height should be at least twice the distance from the lead-in trendline to the average price in that phase.
- Run phase: After peaking, price reverses sharply and falls back below the lead-in trendline, confirming the reversal.
The entire structure resembles a steep run-up (the bump) that becomes unsustainable, followed by a breakdown.
Pattern Psychology
The BARR Top illustrates trend acceleration and exhaustion:
- Lead-in: A normal, healthy uptrend keeps participants confident. Buyers accumulate steadily, and sellers take profits in manageable amounts.
- Bump: Euphoria sets in. Latecomers chase the rally, driving price up at an unsustainable angle. Smart money uses this stage to distribute holdings into strength.
- Run: Once demand is exhausted, the steep trend collapses. Trapped buyers panic as price slices back through the lead-in line. Sellers dominate, and the prior uptrend is decisively reversed.
The psychology is classic: confidence → greed → fear.
Reliability Stats
Bulkowski’s research on BARR Tops:
- Downward break frequency: ~69%.
- Failure rate: ~10%.
- Average decline after breakdown: ~25%.
- Timeframe: Lead-in phase typically lasts weeks to months; bump and run unfold quickly afterward.
- Volume pattern: Expands sharply during bump, collapses during run.
This makes the BARR Top a reliable and profitable reversal setup.
Trade Plan
Entry:
- Conservative: Short once price closes below the lead-in trendline.
- Aggressive: Anticipate reversal as slope steepens excessively.
Stop loss: Above the bump peak (conservative) or above last swing high.
Targets: Minimum = height of bump projected downward. Secondary = major support zones from the lead-in phase.
Invalidation: A sustained rally above bump peak cancels the setup.
Nuances & Common Traps
- Too shallow: If bump is not at least twice the lead-in height, the setup is weak.
- Early shorts: Entering during the bump can be risky; prices may continue steepening longer than expected.
- Fake runs: Price may dip below lead-in briefly then recover; wait for confirmation.
- Angle of slope: Steeper lead-ins are less reliable — best setups have modest lead-ins followed by dramatic bump.
When to Skip
- If bump phase is small or poorly defined.
- If volume doesn’t surge during bump.
- If broader market trend remains strongly bullish.
- If breakdown occurs without momentum or volume confirmation.
Summary
The Bump-and-Run Reversal Top is a bearish reversal pattern where a normal uptrend accelerates unsustainably before collapsing. It breaks down ~69% of the time with ~25% average declines. The most reliable setups feature shallow lead-ins, steep bumps at least twice the lead-in height, and breakdowns confirmed with strong volume.