


What Is VWAP In Trading: Understanding Price Through Volume

You've probably noticed that some price levels seem to hold more significance than others. A stock might bounce repeatedly off $50.23 while barely acknowledging $50.45. The difference isn't random. Those sticky price points often represent where substantial volume changed hands—where real money made real decisions.
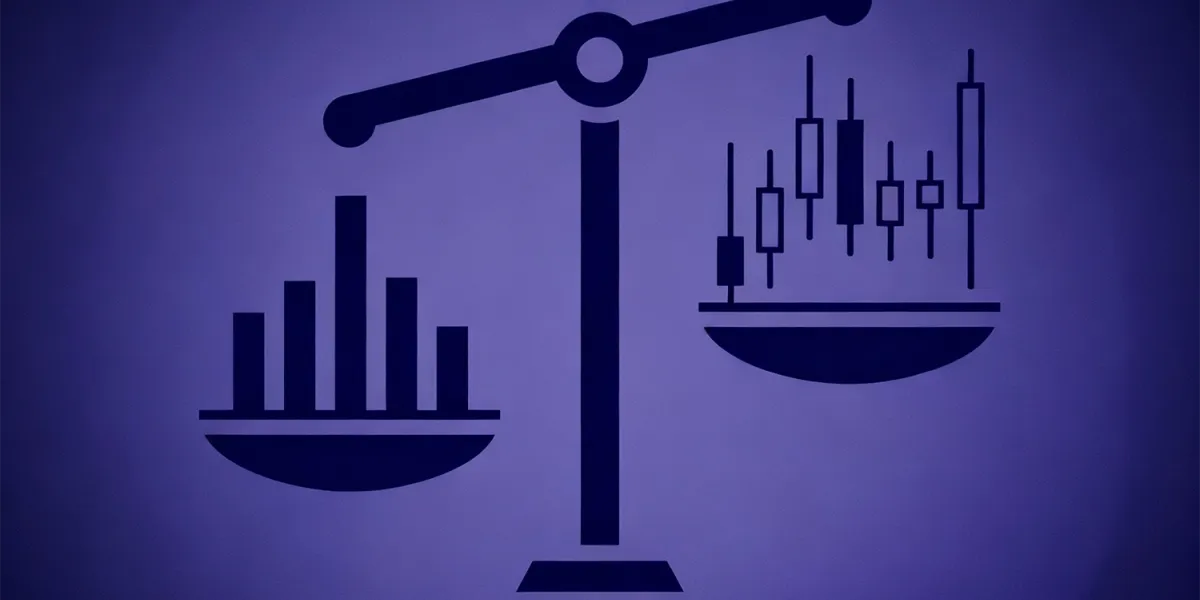
Not All Prices Carry the Same Weight
Here's the thing about markets: a price that traded 10,000 shares matters differently than one that traded 100,000 shares. When you look at a standard candlestick chart, both appear equally important. They're just points on a line. But that's like saying every sentence ever written carries equal cultural weight. Volume tells you where the crowd actually showed up, where conviction lived, where institutions put serious capital to work.
What VWAP Actually Means
VWAP stands for Volume-Weighted Average Price. Strip away the technical terminology and you get something straightforward: the average price weighted by how much actually traded at each level. Think of it as the market's center of gravity for the day.
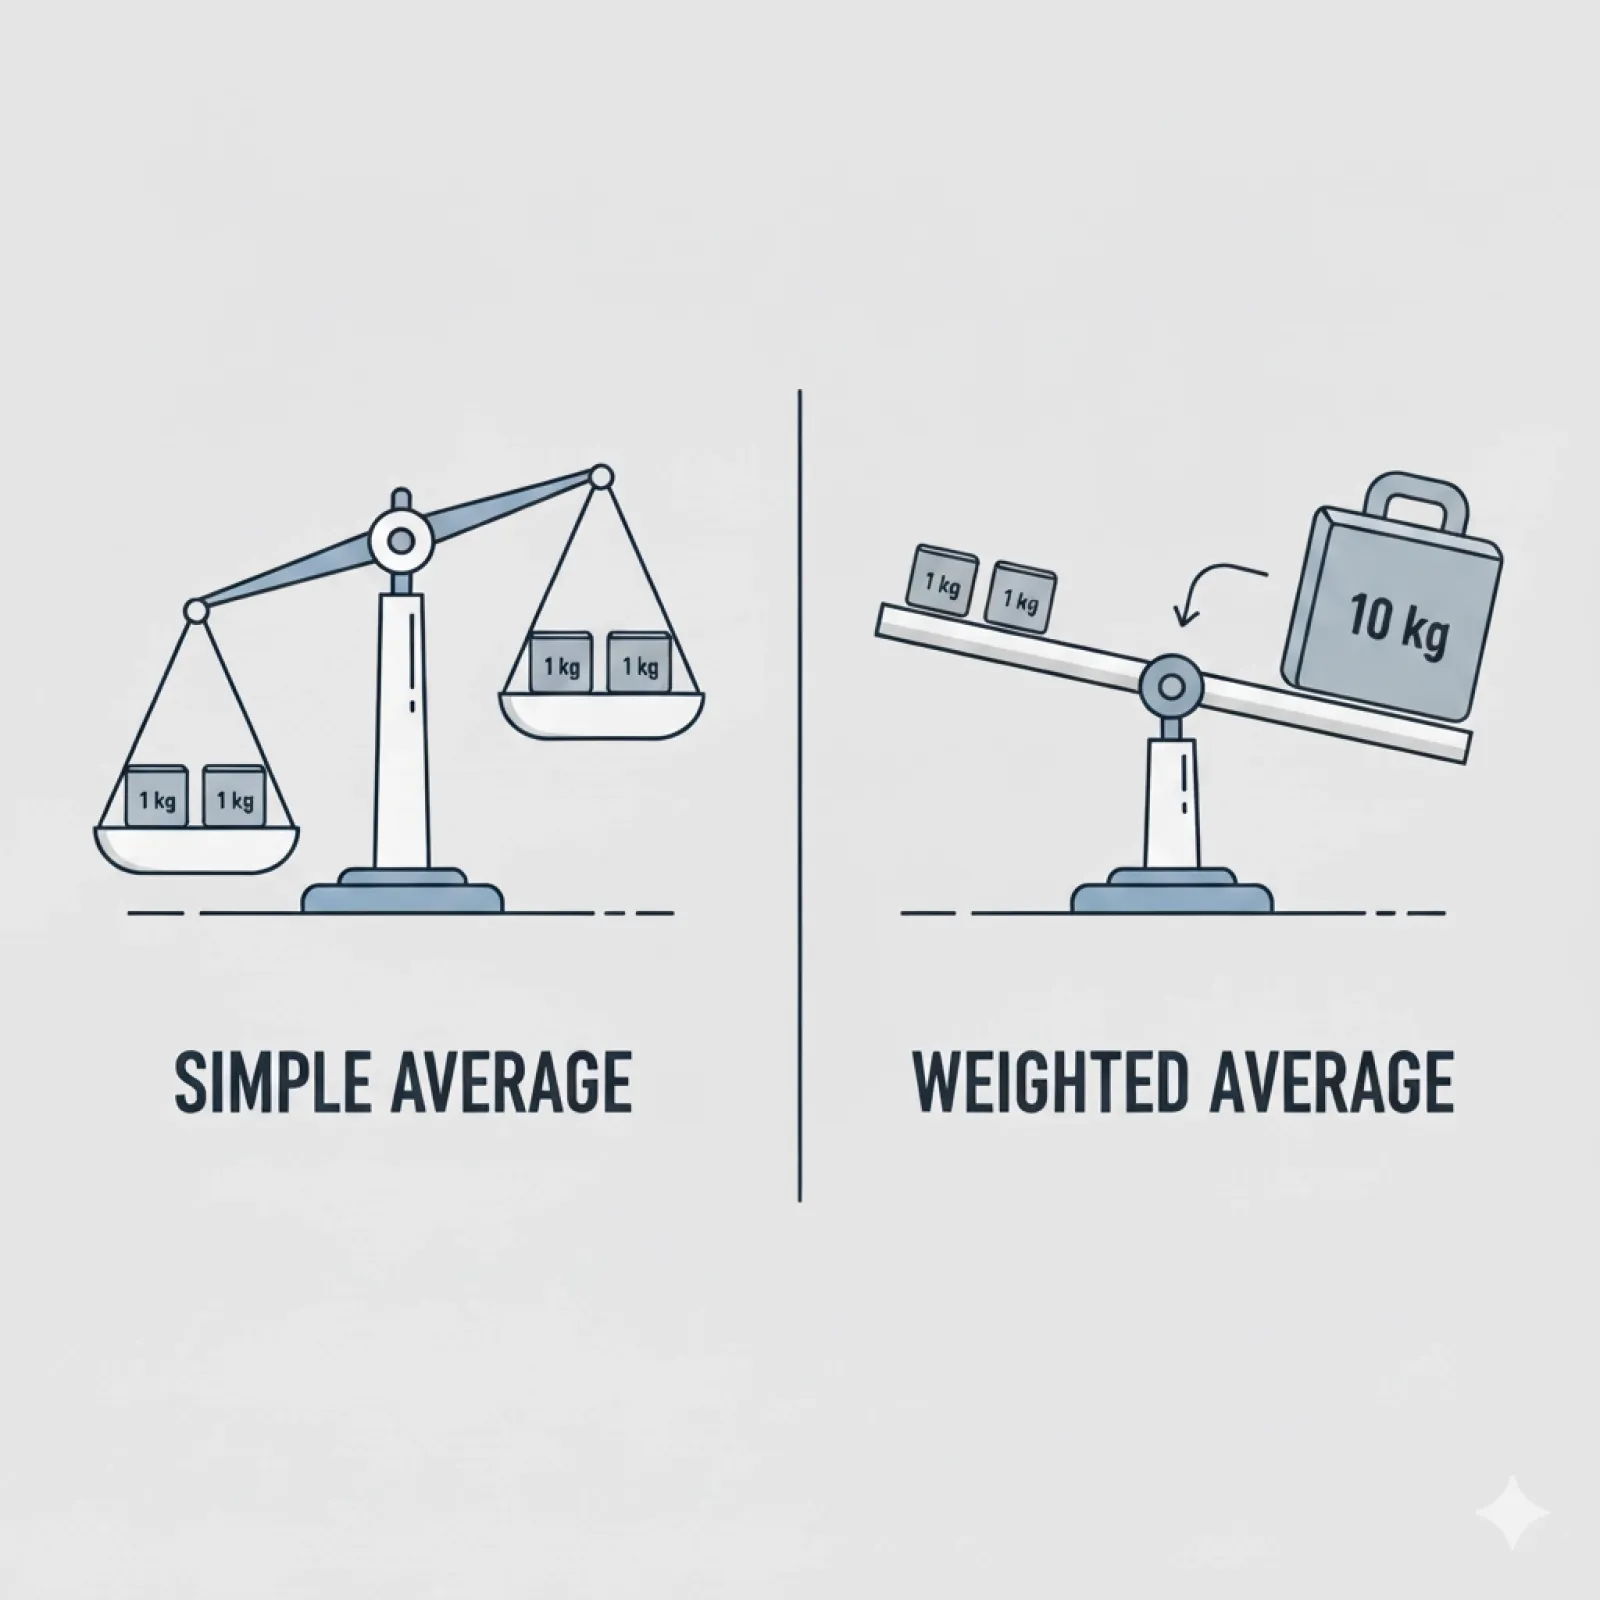
Here's what makes it different from a simple average:
-
Regular average: Add all prices, divide by the number of prices
-
VWAP: Multiplies each price by its volume, then divides by total volume
-
The result: Prices with heavier volume pull the average toward them
-
What you see: A single line that represents where most of the money changed hands
Why Understanding What Is VWAP In Trading Changes Your Perspective
When you know where the volume-weighted average sits, you know something about the current state of play. If price is trading above VWAP, buyers who purchased at the average price are in the green. Below it, they're underwater. This creates natural psychological zones. Institutions often benchmark their execution quality against VWAP—did they buy above or below the average? That simple question influences billions in daily trading decisions, which means it influences how price moves around that level. You're not just reading a line on a chart. You're reading the collective scoreboard of the trading day.
Understanding VWAP: The Basics

The beauty of VWAP lies in its refusal to treat all trading activity as equal. While most indicators draw lines based purely on price movement, VWAP asks a better question: where did the actual business of the market take place? This shift in perspective—from price alone to price multiplied by participation—gives you a more honest picture of market sentiment.
Price + Volume = Context
When you're trying to understand what is VWAP in trading, start here: every transaction has two components that matter. The price tells you where it happened. The volume tells you how much it mattered. A spike to $52 on 500 shares barely registers. That same spike on 500,000 shares rewrites the story.
VWAP combines these elements:
-
Price movement shows you the path the market took
-
Volume distribution shows you where the market meant it
-
VWAP calculation weights each price point by its trading activity
-
The output reveals where the balance of conviction actually sits
How VWAP Differs From a Regular Moving Average
A 20-period moving average treats the last 20 price bars identically. Bar 1 gets the same weight as Bar 20, regardless of whether three people traded or three thousand. VWAP doesn't work that way. It knows the difference between a quiet drift and a volume surge. When institutions place large orders, VWAP feels it. When retail traders nibble at the edges, VWAP barely moves. This makes it particularly useful for reading institutional interest—the smart money leaves bigger footprints.
The Math Behind VWAP (Without the Headache)
You don't need to calculate this manually—your charting platform handles it. But knowing the mechanics helps you understand what you're looking at:
-
Step 1: Take the typical price for each period (high + low + close, divided by 3)
-
Step 2: Multiply that typical price by the volume for that period
-
Step 3: Add up all those price-volume products from the start of the day
-
Step 4: Divide by the total volume traded so far
-
The result: A cumulative average that gets harder to move as the day progresses and volume accumulates
Why Institutions Actually Care About This Metric
Large traders face a problem you probably don't: their orders move markets. When a fund needs to buy 200,000 shares, they can't just hit the ask and call it done. They need to spread that order across the day, trying to achieve an average price that doesn't look embarrassing on the monthly performance report. VWAP becomes their benchmark. Did they execute better or worse than the average trader? Portfolio managers get evaluated on this. Trading desks get judged on this. When billions in capital care about a specific reference point, that reference point starts to influence price action in predictable ways. They're not just watching VWAP—they're actively trying to trade around it, which makes it a self-fulfilling phenomenon worth understanding.
How VWAP Works Throughout the Trading Day

VWAP isn't static. It breathes with the market, shifting and settling as traders cast their votes with real capital. Watch it at 9:35 AM and you'll see something different than at 2:00 PM, not because the formula changed, but because the story of the day keeps getting written with each new wave of volume.
The Opening Bell and VWAP's Starting Point
Right when the market opens, VWAP has almost no history to lean on. Those first few minutes are chaos—overnight news getting digested, pending orders flooding in, everyone trying to figure out what fair value looks like today. VWAP starts calculating immediately, but with limited data, it's jumpy. A single large print can yank it around.
What happens at the open:
-
Initial prints carry disproportionate weight in the calculation
-
VWAP line swings more dramatically than it will later
-
Early positioning by institutions can set the tone for the entire day
-
The first 30 minutes often determine whether VWAP will act as support or resistance
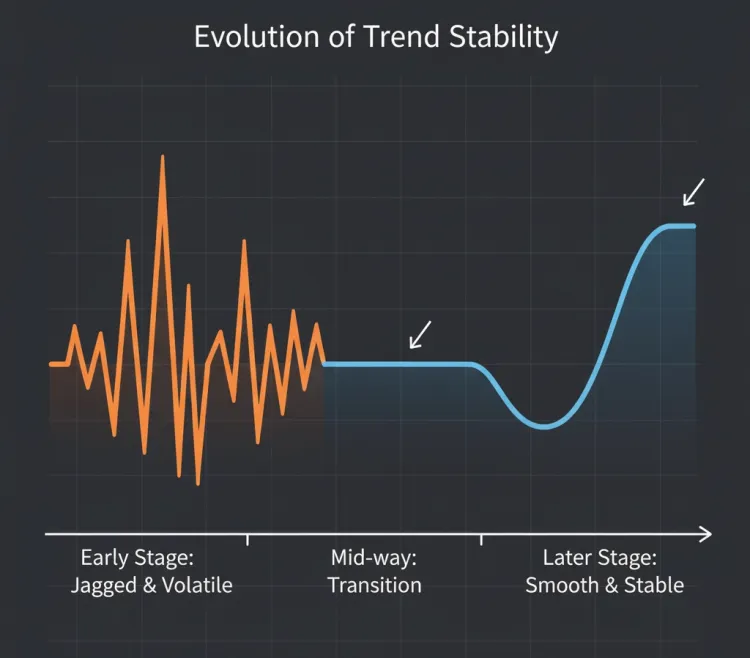
How It Evolves as Volume Accumulates
As the day progresses and millions of shares change hands, VWAP becomes increasingly stable. Think of it like a ship—easy to turn when it's empty, harder to budge when fully loaded. By midday, you've got hours of volume baked into the calculation. Moving VWAP now requires sustained pressure, not just a single spike. This evolution matters because what is VWAP in trading changes character throughout the session. Morning VWAP is reactive and volatile. Afternoon VWAP is established and resistant to change. Smart traders adjust their expectations accordingly.
Why It Acts as a Dynamic Reference Point
VWAP gives both buyers and sellers something to care about simultaneously. Buyers below VWAP are winning the day. Sellers above VWAP are winning the day. This creates natural tension around the line. When price approaches VWAP, you often see increased activity as participants defend their psychological territory. The line becomes a magnet and a battleground at the same time—attracting price action precisely because everyone's watching it.
Being Above vs. Below VWAP: What It Tells You
If price is trading above VWAP: Then the average participant who traded today is profitable, which creates support as those traders defend their gains and new buyers see momentum.
If price is trading below VWAP: Then the average participant is underwater, which creates resistance as those traders look for opportunities to exit at breakeven.
If price keeps reclaiming VWAP after dips: Then buyers are in control and using VWAP as a launching pad for continuation moves.
If price keeps rejecting at VWAP from below: Then sellers are in control and VWAP represents the ceiling where supply overwhelms demand.
If price is hugging VWAP tightly: Then the market is balanced, indecisive, and likely consolidating before the next directional move.
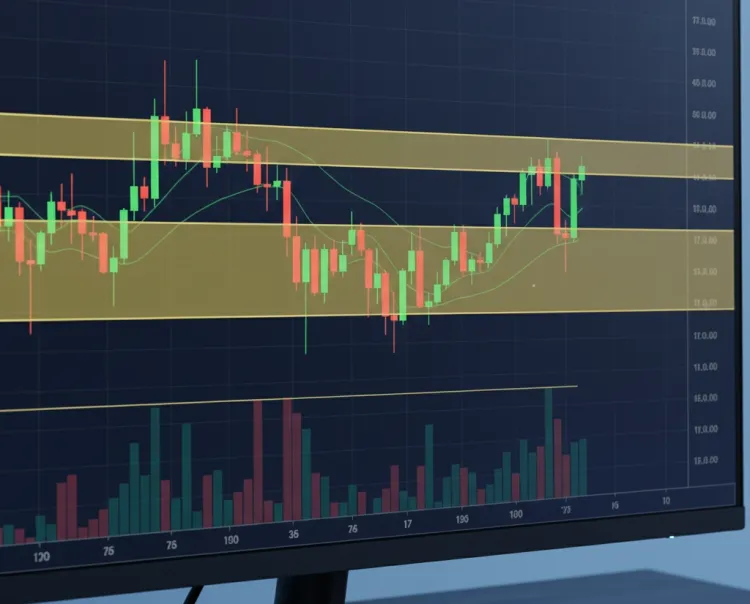
Reading VWAP Like a Professional


The line itself means nothing. What matters is how price behaves around it. A single touch tells you something. Multiple touches tell you a story. The way traders respond to VWAP—whether they defend it, reject it, or ignore it entirely—reveals the current power structure of the market.
Key behaviors to watch:
-
Clean bounces suggest strong directional conviction and willing participants
-
Choppy grinding around VWAP indicates indecision and lack of commitment
-
Quick rejections show one side defending their territory aggressively
-
Slow bleeds through VWAP signal weakening resolve and potential trend changes
-
Violent reclaims often mark the beginning of momentum shifts
What It Means When Price Bounces Off VWAP
A bounce isn't just price moving away from a line. When price drops to VWAP and immediately springs back, buyers stepped in with conviction at that exact level. They saw value. They acted. The bounce tells you VWAP is functioning as support—a floor where demand exceeds supply. But here's what separates casual observation from professional reading: watch the quality of the bounce. Does price rocket away with expanding volume? That's strength. Does it limp higher on declining activity? That's exhaustion masquerading as a bounce. The difference between these two scenarios often determines whether you're entering a continuation or catching a falling knife.
The Significance of Multiple Touches
When price returns to VWAP repeatedly and holds, you're watching a pattern of respect. Each successful test reinforces the level's importance in traders' minds. The first touch might be coincidence. The second touch gets attention. By the third or fourth touch, everyone's watching. This is where understanding what is VWAP in trading becomes practical—multiple touches create anticipation. Traders start placing orders near VWAP, expecting the pattern to continue. This clustering of orders can turn VWAP into a self-fulfilling support or resistance zone. But be aware: nothing holds forever. The more times price tests a level without breaking through decisively, the more energy builds for an eventual breakdown or breakout.
Quick tips for reading multiple touches:
→ Three or more bounces typically signal strong support/resistance
→ Watch for decreased bounce strength—each weaker reaction suggests exhaustion
→ Volume at each touch matters more than the touch itself
→ Failed breaks (fake-outs) often lead to explosive moves in the opposite direction
How to Spot VWAP Acting as Support or Resistance
Context determines function. VWAP doesn't choose to be support or resistance—price action assigns that role. When price trades above VWAP and dips back to test it, you're looking for support behavior. When price trades below VWAP and rallies up to meet it, you're looking for resistance behavior.
Watch for these confirmations:
-
Support confirmation: Price touches VWAP from above and buyers immediately absorb selling pressure with strong green candles
-
Resistance confirmation: Price touches VWAP from below and sellers immediately push back with strong red candles
-
Role reversal: Previous resistance becomes new support after a convincing break and retest, or vice versa
-
Volume signature: Heavier volume on bounces and lighter volume on approaches suggests the level is being defended
-
Price structure: Higher lows forming at VWAP (support) or lower highs forming at VWAP (resistance) build tradeable patterns
VWAP Across Different Timeframes

Most traders discover VWAP in the context of day trading and never look beyond that single application. That's like learning one chord on a guitar and declaring yourself done. VWAP adapts across timeframes, and understanding these variations can change how you read market structure on multiple levels simultaneously.
Intraday Trading: Where VWAP Shines Brightest
Standard VWAP resets at the open each day, which makes it perfect for intraday work. You get a fresh reference point every morning, calculated from scratch as volume flows in. Day traders use this to gauge whether their entries beat the market's average price—a simple but powerful benchmark. Scalpers watch for quick bounces. Momentum traders look for price staying persistently above or below VWAP as confirmation of directional strength. The daily reset creates clean setups that don't carry baggage from previous sessions. By 4:00 PM, the story is over. Tomorrow brings a blank slate.
Pro tip: The most reliable VWAP setups often occur in the first 90 minutes and last 90 minutes of the trading day, when volume and institutional participation are highest. The midday chop tends to produce noisier signals.
Multi-Day VWAP (Anchored VWAP)
Here's where it gets interesting. What if you don't reset VWAP daily? What if you anchor it to a specific event—an earnings report, a major high or low, the start of a quarter? Anchored VWAP calculates from your chosen starting point forward, creating a volume-weighted average that can span days, weeks, or months. Swing traders use this to understand the average entry price for everyone who's been involved since a meaningful market event.
How anchored VWAP differs:
-
Calculation period: You choose where it starts, not the market open
-
Use case: Tracking longer-term position averages and institutional accumulation
-
Typical anchors: Earnings dates, major tops/bottoms, breakout points, trend starts
-
What it reveals: Whether current price represents value relative to participants who entered at major turning points
-
Limitations: Becomes less relevant as you move further from the anchor date
Which Timeframe Fits Your Trading Style
If you're taking positions that last minutes to hours, standard daily VWAP gives you what you need. If you're holding for days or weeks, anchored VWAP tied to significant price events provides better context. The question isn't which version is better—it's which one matches your holding period and decision-making process. A scalper anchoring VWAP to last month's earnings makes no sense. A position trader ignoring multi-day VWAP is missing useful information. Match the tool to the job. When you understand what is VWAP in trading across these different applications, you can layer multiple timeframes for a fuller picture: daily VWAP for immediate support and resistance, anchored VWAP for longer-term context about where the "smart money" entered during a major move.
The Bottom Line: VWAP isn't one-size-fits-all—daily VWAP suits short-term traders, while anchored VWAP serves longer-term players, and the best traders often use both to see different layers of market structure simultaneously.
Practical Applications


Theory becomes useful when you can actually apply it. VWAP stops being an interesting concept and starts being a practical tool the moment you ask: how does this change what I do right now? The answer depends on whether you're getting in, getting out, or trying to confirm what other indicators are telling you.
Using VWAP to Gauge Trade Entry Quality
Getting filled is easy. Getting filled at a good price takes awareness. VWAP gives you an objective standard for evaluating whether your entry was decent or whether you chased poorly. If you're buying above VWAP, you're paying more than the average trader paid today—that's not automatically bad, but it means you need the momentum to continue. If you're buying below VWAP, you're getting a better price than average—useful if you're trying to position before a bounce.
Entry considerations when using VWAP:
-
Buying above VWAP: You're betting on continuation and joining the winning side, but you're paying up for conviction
-
Buying at or near VWAP: You're getting the average price, which works well for scaling into positions without overpaying
-
Buying below VWAP: You're getting value relative to the day's participants, useful for catching bounces or building positions in downtrends
-
Selling above VWAP: You're distributing into strength, taking profits above the market's average cost basis
-
Selling below VWAP: You're exiting in weakness, accepting worse prices than average but potentially avoiding further deterioration
Exit Strategies Around VWAP Levels
Knowing when to leave matters as much as knowing when to enter. VWAP provides logical exit zones based on where the broader market established value. If you bought below VWAP and price rallies back to it, you've got a decision point—does price break through or reject? Understanding what is VWAP in trading means recognizing these moments as natural profit-taking opportunities or places to tighten stops.
Common exit approaches:
-
Taking partials at VWAP: Lock in gains when price reaches the day's average, let the rest run if momentum continues
-
Using VWAP as a trailing stop: As long as price holds above VWAP in an uptrend, stay in; exit when it breaks below
-
Targeting distances from VWAP: Some traders exit at 1% or 2% away from VWAP, using standard deviations as price extension targets
-
VWAP reclaim failures: If price tries to break through VWAP and fails, that rejection often signals a reversal and exit opportunity
-
End-of-day VWAP: Day traders often close positions if they're on the wrong side of VWAP heading into the final hour
How to Combine VWAP with Other Tools
VWAP doesn't need to work alone. Pair it with volume profile to see where volume concentrated at specific prices. Add traditional support and resistance levels to identify confluence zones where multiple factors agree. Use momentum indicators to confirm whether moves away from VWAP have follow-through potential. The strongest setups occur when VWAP aligns with other technical factors—a VWAP bounce that also coincides with a major support level and oversold RSI carries more weight than VWAP in isolation. Think of VWAP as one voice in a conversation. When multiple voices say the same thing, you've got clarity worth acting on.
Remember: VWAP tells you where the average trade happened, but it doesn't tell you where price should go next—combine it with price action, volume analysis, and key levels to build a complete picture rather than relying on any single indicator to carry your decisions.
Common Mistakes and Misconceptions

Every useful tool attracts magical thinking. Traders discover VWAP, see a few clean bounces, and suddenly it becomes their entire strategy. They stop reading price action. They ignore volume. They trade the line like it's been blessed by some market deity. Then they get chopped up and blame the indicator. The problem wasn't VWAP—it was expecting too much from it.
VWAP Isn't a Crystal Ball
VWAP tells you what already happened, not what comes next. It's a volume-weighted average of past transactions, nothing more. When price bounces off VWAP, that doesn't mean it will bounce the next time. When price breaks through VWAP, that doesn't guarantee a trend reversal. The line reflects history. Your job is interpreting whether that history matters for the current moment.
What VWAP doesn't do:
-
Predict future price movement: It describes the past, doesn't forecast the future
-
Work in isolation: Without context from volume, price action, and broader market conditions, it's just a line
-
Guarantee successful trades: Even perfect VWAP setups fail when external factors override technical patterns
-
Replace risk management: A bounce off VWAP doesn't mean you skip your stop loss
-
Account for news or events: Unexpected information can blow through VWAP like it doesn't exist
Why Context Matters More Than the Line Itself
VWAP during a slow, low-volume grind means something different than VWAP during a high-volume breakout. A stock trading near VWAP with tight spreads and calm action tells you one story. The same stock whipping back and forth across VWAP with violent candles tells you another. Understanding what is VWAP in trading requires looking beyond the calculation to see what the market is actually doing.
Context clues that change everything:
-
Volume character: Are bounces off VWAP accompanied by rising or falling volume?
-
Market environment: Is the broader market trending, consolidating, or selling off?
-
Time of day: Morning VWAP behaves differently than afternoon VWAP
-
Recent price action: Did price just make a major move, or has it been range-bound?
-
Spread and liquidity: Tight markets respond to VWAP differently than wide, illiquid ones
When VWAP Gives False Signals
Price touches VWAP and bounces—you buy. Then it immediately reverses and stops you out. Happens to everyone. VWAP can act as a magnet that attracts price just long enough to trap traders before the real move occurs in the opposite direction. False signals increase during choppy, directionless sessions when no real trend exists. They show up at extremes when price has stretched too far from VWAP and needs to mean-revert. They appear during low-volume periods when a few large orders can push price around without meaningful follow-through. The answer isn't abandoning VWAP—it's recognizing that no indicator works in every condition. When market structure is messy, when volume is thin, when larger timeframes show no clear direction, VWAP becomes just another line getting tested and broken without consequence. That's not failure. That's reality. The traders who survive are the ones who can tell the difference between a high-probability VWAP setup and noise that happens to touch the line.
What Is VWAP In Trading: Your Next Step Forward
VWAP won't make you rich by itself. No single indicator will. But it can change how you see market structure, how you evaluate your entries and exits, and how you think about where real conviction lives in the daily flow of trading. That shift in perspective—from price alone to price weighted by actual participation—might be the difference between guessing and reading what's actually happening in front of you.
Building Your VWAP-Informed Approach
Start by watching. Before you trade using VWAP, spend time observing how price behaves around it in different market conditions. Notice when it holds and when it breaks. See which bounces have follow-through and which ones fade immediately. Track whether your particular stocks respect VWAP or ignore it. Some assets treat it like gospel. Others treat it like a suggestion. Your job is figuring out which category you're trading. Add VWAP to your charts, but don't add trades based on VWAP until you've seen enough patterns to trust your interpretation. Understanding what is VWAP in trading means knowing not just the definition, but how it actually behaves in the specific markets you trade. That knowledge comes from observation, not from reading articles or watching videos. The education happens in real-time, watching real volume interact with real price action. When you've seen enough, you'll know. And when you know, you'll have a tool that gives you context most traders miss—where the money actually showed up, where the volume made its statement, where the day's participants set their baseline for value. That's not everything you need to trade well, but it's something worth having in your toolkit.
