


Understanding Market Profile Trading


Market profile is a way of organizing and displaying price data that shows you where the most trading activity occurred, not just where price went. Unlike traditional candlestick or bar charts that emphasize time, market profile emphasizes volume distribution—showing you which price levels had the most participation and where institutions positioned themselves. This shift in perspective helps you see the market the way professional traders see it: as an auction where certain price levels attract more interest than others.
Origins and Development
Market profile was developed by Peter Steidlmayer at the Chicago Board of Trade in the 1980s as a tool for understanding market structure and participant behavior. Floor traders needed a way to see beyond just price movement and understand where the real business was being done—where buyers and sellers were actually transacting in size.
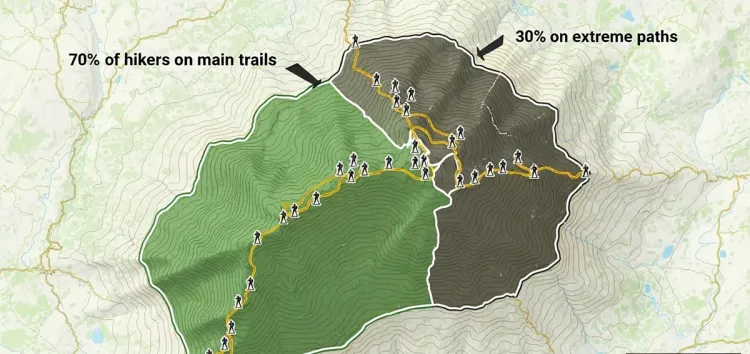
The methodology organizes trading activity into 30-minute periods throughout the session, creating a visual distribution that typically forms a bell curve. This bell curve shows the value area—the price range where 70% of the day's volume occurred. The idea is simple but powerful: markets spend most of their time near fair value, and understanding where that value sits helps you make better trading decisions about when price is extended and likely to revert, or when it's breaking into new territory.
Why Market Profile Matters
Market profile trading reveals information that time-based charts hide or obscure, giving you insight into institutional behavior and market structure.
What market profile shows you:
-
Volume concentration: Which specific price levels had the most trading activity and where institutions were most active
-
Fair value range: The 70% value area where the market considers price acceptable and does most of its business
-
Imbalances: When price moves too far from value too quickly, suggesting potential mean reversion opportunities
-
Acceptance vs. rejection: Whether the market accepted higher/lower prices or rejected them by trading back into value
-
Point of Control (POC): The single price level with the highest volume—a magnetic level price tends to revisit
-
Institutional footprint: Large volume nodes reveal where big money positioned itself, providing reference points for future trading
-
Market type identification: The profile shape tells you if the day was trending, balanced, or rotational
Market profile shifts your focus from asking "where did price go?" to asking "where did the most trading occur and what does that tell me about where institutions see value?"—this volume-based perspective reveals market structure and participant behavior that time-based charts simply can't show.
Understanding Value Area

The value area is the heart of market profile trading—it's where 70% of the session's volume occurred, representing the price range the market deemed fair and acceptable. Understanding value area boundaries and how price interacts with them gives you a framework for identifying when price is fairly valued versus overextended, and where institutions are likely positioned.
Key value area components:
-
The 70% rule: Value area contains 70% of the day's TPOs or volume—this is where the market did most of its business
-
Value Area High (VAH): The upper boundary of the value area—acts as resistance when price trades below it, support when price trades above it
-
Value Area Low (VAL): The lower boundary of the value area—acts as support when price trades above it, resistance when price trades below it
-
Point of Control (POC): The price level with the highest volume or most TPOs—represents the fairest price where maximum business occurred
-
Fair value zone: The area between VAH and VAL where the market considers price acceptable and balanced
-
Outside value: Price trading above VAH or below VAL is considered extended and more likely to revert back to value
-
Overlapping value: When today's value area overlaps yesterday's, it confirms price acceptance at those levels
How Price Interacts with Value
Understanding how price behaves relative to value area boundaries helps you anticipate market moves and identify trading opportunities.
IF price opens inside the value area… THEN the market is starting near fair value and could rotate within the range or break out in either direction.
IF price opens above the value area (above VAH)... THEN buyers controlled overnight, but watch for acceptance above value or rejection back into it.
IF price opens below the value area (below VAL)... THEN sellers controlled overnight, but watch whether the market accepts lower prices or rejects back into value.
IF price trades outside value and keeps extending… THEN the market is rejecting yesterday's value and discovering new fair value at different levels.
IF price trades outside value but quickly returns inside… THEN the market rejected the extension and confirmed yesterday's value remains valid.
IF price keeps returning to the POC throughout the session… THEN that price level is acting as a magnet where participants keep finding balance.
IF today's value area overlaps significantly with yesterday's… THEN the market is in balance and considers that price range fair over multiple days.
Why Value Areas Matter
Value areas reveal where the real business happens—not just where price wicked on a chart, but where institutions actually positioned size and where the market found equilibrium. This information is powerful because it shows you institutional reference points.
Large traders don't chase price randomly. They build positions near value where they can accumulate or distribute without moving the market dramatically against themselves. When you see thick volume nodes within the value area, especially at the POC, you're seeing where big money transacted. These levels become magnetic—price tends to revisit them because both buyers and sellers recognize them as fair prices where they're willing to trade.
The value area also helps you understand market context. When price trades within value, the market is balanced and mean reversion strategies make sense. When price breaks out of value and stays out, the market is trending and directional strategies work better. The 70% rule gives you an objective measure of where acceptance occurs versus where price just briefly explored without finding participants willing to do business.
Reading the Profile Shape

The visual shape that emerges as the market profile builds throughout the session tells you what type of day occurred and what that means for participant behavior. Different shapes reveal different market conditions—trending, balanced, rotational, or transitional—and each shape gives you clues about what might happen next.
Common profile shapes and their meanings:
-
Normal distribution (bell curve): Symmetrical shape with most TPOs in the middle—balanced day where price found fair value and rotated around it
-
P-shape (trend up): Fat top with thin tail at bottom—started lower, trended higher, and spent most time at the top accepting higher prices
-
b-shape (trend down): Fat bottom with thin tail at top—started higher, trended lower, and spent most time at the bottom accepting lower prices
-
Double distribution: Two distinct bell curves separated by a gap—market found value at two different levels during the session
-
Neutral day: Wider distribution without clear trend—price explored range but didn't establish clear directional conviction
-
D-shape: One-sided auction with no opposite tail—extreme trending day where price only moved in one direction
-
Bracket day: Narrow range with thick distribution—back-and-forth rotation within tight value area
What Each Shape Reveals
The profile shape is a fingerprint of the day's auction process, showing you how buyers and sellers negotiated and where they ultimately agreed on fair value.
Normal distribution profiles tell you the market was balanced. Price opened, explored both directions, and settled into a range where most participants were comfortable trading. These days often follow trending days as the market digests the move and establishes new value. When you see a bell curve, expect the next day to either continue consolidating around that value or break out once the balance is resolved.
Trend day profiles (P-shape and b-shape) show directional conviction. The fat part of the profile is where the market accepted new prices and spent most of its time. The thin tail shows where the day started before the trend developed. These shapes tell you that one side (buyers for P-shape, sellers for b-shape) controlled the session and established value at the extreme. The next day often opens near that extreme, and whether price continues or reverts tells you if the trend has more to go.
Double distribution days reveal two-timeframe traders disagreeing about value. The market established one value area, then broke out and established a second value area at different prices. The gap between the two distributions often becomes important—if price returns to fill that gap, it's revisiting inefficient price discovery. If price stays in the new distribution, the market accepted the value shift.
Keep In Mind: The market profile shape gives you context for the type of day that occurred—trending, balanced, or rotational—but the shape alone doesn't predict tomorrow's action without considering whether today's value was accepted or rejected, where price closed relative to the range, and how today's value relates to prior days' profiles.
Value Area Migration


Value doesn't sit in the same place forever. When today's value area moves higher or lower compared to yesterday's, the market is telling you something about supply and demand dynamics. Understanding value migration—when it's orderly versus when it's imbalanced—helps you anticipate whether trends will continue or revert.
IF today's value area sits mostly above yesterday's value area with some overlap… THEN value is migrating higher in an orderly fashion—buyers are willing to accept higher prices gradually.
IF today's value area sits completely above yesterday's with no overlap… THEN the market gapped value higher—strong imbalance favoring buyers with potential continuation.
IF today's value area overlaps 80%+ of yesterday's value area… THEN the market is balanced and considers the same price range fair—rotation within value expected.
IF today's value area sits mostly below yesterday's value area with some overlap… THEN value is migrating lower in controlled manner—sellers are gradually pushing fair value down.
IF today's value area sits completely below yesterday's with no overlap… THEN the market gapped value lower—strong imbalance favoring sellers with potential continuation.
Balanced vs. Imbalanced Markets
Balanced markets show value areas that overlap significantly across multiple days. The market has found a price range it considers fair and keeps returning to it. Volume is distributed evenly within the range, and neither buyers nor sellers have the conviction to push price decisively out of value. These conditions favor mean reversion strategies—when price moves to value area extremes, it tends to rotate back toward the POC.
Imbalanced markets show value migrating directionally with minimal overlap between days. Each day's value area establishes higher or lower than the previous day's, creating a staircase pattern of ascending or descending value. This tells you that one side (buyers in uptrends, sellers in downtrends) has control and is willing to accept progressively higher or lower prices. Imbalanced markets favor trend-following strategies—price breaks out of value and keeps discovering new value at different levels rather than reverting.
Auction Theory and Price Discovery
Markets operate as auctions where price moves to find the level that attracts the most two-sided trade. When price is too high, buyers disappear and sellers dominate, pushing price lower. When price is too low, sellers disappear and buyers dominate, pushing price higher. The market profile shows you the result of this auction process.
Price discovery happens when the market is searching for fair value. You see this as range extensions, single prints, and migration of the value area. When price discovers a level where both buyers and sellers are active, volume increases and price spends time there—this becomes the POC. When price explores a level and finds only one-sided interest, it moves quickly through (creating single prints) without establishing value.
Acceptance and Rejection Signals
Understanding whether the market accepted or rejected a price level is key to reading market intent from value movement.
Signs of acceptance:
-
Price trades outside prior value area and stays there, building new value at the extended level
-
Volume increases at the new price level—participants are willing to transact there
-
Multiple TPO periods stack up showing price spent time at the level
-
Next day opens near the extension and continues from there
-
Value area migrates toward the direction of the breakout
Signs of rejection:
-
Price trades outside prior value area but quickly returns inside
-
Volume decreases at extended levels—participants unwilling to do business there
-
Single prints appear as price moves quickly through without accumulation
-
Next day opens back inside prior value or gaps toward it
-
Value area remains at prior levels despite the price excursion
Understanding Migration Patterns
Tracking how value moves over multiple days reveals the market's directional bias and institutional positioning.
Did You Know? When value migrates directionally for 3-5 consecutive days with minimal overlap, you're typically in a trending market where one side has clear control—this pattern often continues until value stops migrating and begins overlapping again.
Did You Know? Markets spend about 70% of the time in balanced conditions where value overlaps significantly from day to day, and only 30% of the time in trending conditions where value migrates directionally—this is why mean reversion strategies work more often than trend-following.
Did You Know? The fastest value migrations often occur after long balanced periods when the market finally breaks out—the pent-up energy from the balance creates strong directional moves with multiple days of migrating value in the breakout direction.
Trading Above and Below Value

Where price opens relative to the previous day's value area gives you immediate context for the trading session. Opens above value, below value, or inside value each create different scenarios with different probabilities. Understanding these relationships helps you anticipate whether the market will continue trending or revert back to prior value.
Opening scenarios and their implications:
-
Open above value (above VAH): Buyers controlled overnight, price starting from extended levels—watch for continuation higher or rejection back into value
-
Open below value (below VAL): Sellers controlled overnight, price starting from extended levels—watch for continuation lower or rejection back into value
-
Open inside value: Price starting near fair value—could rotate within the range or break out in either direction
-
Open at VAH or VAL: Starting right at value extremes—clean breakout or rejection scenarios often develop
-
Open at POC: Starting at fairest price—balanced open with equal probability for both directions
-
Gap above value: Strong overnight conviction—gap fill back to value vs. gap-and-go continuation
-
Gap below value: Strong overnight selling—gap fill back to value vs. continued selling pressure
Mean Reversion vs. Continuation
The key question when price opens outside value is whether it will rotate back toward value (mean reversion) or continue extending away from it (trend continuation).
Mean reversion scenarios are more common—about 70% of the time, price that opens outside value will eventually trade back into the prior day's value area during the session. This happens because the market considers yesterday's value still relevant, and extended prices attract the opposite side. Opens above value attract sellers who see prices as too high. Opens below value attract buyers who see prices as too low.
However, 30% of the time, price accepts the new level and continues away from prior value. This happens when the overnight news or market conditions genuinely shifted what participants consider fair value. The market discovers new value at different price levels and doesn't look back. These become trending days where fighting the move costs you money.
Identifying Which Scenario Is Playing Out
Reading the early price action after an open outside value tells you whether mean reversion or continuation is more likely.
Signs pointing to mean reversion:
-
Price opens outside value but immediately moves back toward VAH/VAL
-
Volume is light at the extended levels—participants not willing to transact there
-
Price fails to extend further away from value in the first hour
-
Initial balance forms overlapping with or inside prior day's value area
-
Single prints appear as price quickly retraces back toward value
-
By mid-session, price has traded back into prior value area
Signs pointing to continuation:
-
Price opens outside value and continues extending in that direction
-
Volume increases at the new levels—participants accepting the new prices
-
Initial balance forms entirely outside prior day's value area
-
Price spends time building value at the extended levels (multiple TPO stacks)
-
Attempts to trade back into prior value get rejected quickly
-
By mid-session, today's value area is forming at the new extended levels
Remember: When using market profile trading to make decisions about opens outside value, the default assumption should be mean reversion since it happens more often—but watch the first 30-60 minutes closely for signs that the market is accepting the new prices, which would shift your bias from fade trades back to value toward trend-following trades away from it.
Point of Control as Magnetic Price Level


The Point of Control (POC) is the price level where the most volume occurred during a session—it represents the fairest price where the maximum amount of business was transacted. Price has a tendency to gravitate back toward the POC because both buyers and sellers recognize it as a balanced level where they're willing to trade. Understanding this magnetic quality helps you anticipate price movement and identify high-probability setups.
Why POC matters:
-
Highest volume node where most institutional positioning occurred
-
Acts as equilibrium price that attracts future price action
-
Becomes reference point for both support and resistance
-
Price often revisits POC multiple times during and after formation
Trading Near the POC
Price behavior around the POC provides trading opportunities based on whether the level holds or fails.
DO: Watch for price to return to the POC after moving away—the magnet effect creates predictable rotation trades
DO: Use the POC as a support level when price is trading above it—institutions defending their positions creates buying
DO: Use the POC as resistance when price is trading below it—supply at the high-volume node creates selling pressure
DO: Look for breakout opportunities when price consolidates at the POC then breaks out with volume
DON'T: Assume the POC will always hold—sometimes the market rejects prior value entirely and price blows through
DON'T: Fade price at the POC without confirmation—wait to see if the level is actually creating a reaction
DON'T: Ignore the time element—a POC from yesterday is more relevant than one from last week
DON'T: Trade POC levels in isolation—combine with other market profile context like value area position
Multiple Timeframe POC Analysis
The POC exists on every timeframe you look at—daily, weekly, monthly. When multiple timeframe POCs align at the same price level, that zone becomes even more significant as institutional reference point.
A stock might have its daily POC at $150, but if you zoom out to the weekly chart and find the weekly POC is also at $150, you've identified a level where participants across different timeframes agreed on fair value. These confluence zones create stronger support or resistance because short-term traders, swing traders, and position traders all recognize the level as significant.
When price approaches a multi-timeframe POC cluster, expect a reaction. The level has absorbed volume across multiple time horizons, making it a price where institutions are positioned and willing to defend. These become ideal levels for limit orders—buying at support when price tests a multi-timeframe POC from above, or selling at resistance when price tests it from below.
POC as Support and Resistance
The POC's function as support or resistance depends on whether price is trading above or below it. This dynamic creates tradeable scenarios as price interacts with the level.
When price is above the POC, that level acts as support. Institutional longs who transacted at the POC have a vested interest in defending that price—they don't want the market trading below where they bought. This creates buying pressure when price pulls back to test the POC. As long as the level holds, it confirms the value and provides a logical level to enter long positions with stops just below.
When price is below the POC, that level acts as resistance. Institutional shorts who transacted at the POC or longs who missed the initial move create selling pressure when price rallies back to test. The high-volume node becomes a supply zone where participants are willing to sell. Failed attempts to reclaim the POC from below often lead to continued downside as the rejection confirms the bearish structure.
Failed Auctions and POC Breakouts
Sometimes price fails to hold at the POC, and the level breaks decisively. These failed auctions create momentum moves.
Pro tip: When price breaks through a significant POC with strong volume, the level often flips its function—former support becomes resistance on retests, former resistance becomes support.
Pro tip: Failed POC levels create vacuum zones—if price spent a lot of time at the POC building value, the areas above and below may be thin on volume, allowing fast moves once the POC breaks.
Pro tip: Watch for POC rejections on first test vs. second test—first tests often hold, but if price keeps probing the level, the second or third test has higher probability of breaking through as inventory shifts.
Think of it this way: The POC is like a price where the most people agreed to do business—it's the equilibrium point where the market found balance, and just like any equilibrium, when something pushes away from it, there's a natural pull back toward it until enough force accumulates to establish a new equilibrium at a different price level.
Previous Day's Value in Today's Trading


Yesterday's value area and POC don't disappear when the session ends—they remain as reference points that influence how participants approach today's trading. Understanding how today's open relates to yesterday's value gives you immediate context for reading market sentiment and anticipating price behavior.
IF today opens inside yesterday's value area… THEN the market is starting near fair value and participants will test whether yesterday's value remains valid or needs adjustment.
IF today opens above yesterday's VAH… THEN buyers controlled overnight and are willing to accept higher prices—watch for acceptance above value or rejection back into it.
IF today opens below yesterday's VAL… THEN sellers controlled overnight and are willing to accept lower prices—watch for acceptance below value or rejection back into it.
IF today opens right at yesterday's POC… THEN the market is starting at the fairest price from yesterday—balanced open with equal directional probability.
IF today gaps significantly above or below yesterday's entire value area… THEN overnight news or conditions shifted perceived fair value dramatically—the gap represents strong conviction.
IF today's opening range overlaps yesterday's value area… THEN yesterday's value likely remains relevant and price will reference those levels throughout the session.
Overnight Inventory and Positioning
Overnight sessions (for stocks) or 24-hour trading (for futures) create inventory imbalances that affect the day session open. Understanding who's positioned and how becomes visible through the relationship between today's open and yesterday's value.
Gap relationships reveal positioning:
-
Gap up opening above value: Overnight buyers accumulated, creating long inventory that needs to be absorbed—watch if day session accepts higher prices or sellers emerge to fade the gap
-
Gap down opening below value: Overnight sellers created short inventory—watch if day session continues lower or buyers step in to cover and fill the gap
-
Open inside value after trending day: Participants using overnight to position counter to yesterday's move—potential mean reversion as extremes get faded
-
Open at value extremes (VAH/VAL): Clean test of yesterday's boundaries—acceptance creates breakout, rejection creates range-bound day
-
Multiple days opening in same value area: Reinforces that price range as institutional reference—high-probability support/resistance zone
Understanding market profile relationships between previous day's value and today's open reveals institutional positioning and sentiment—where price opens relative to yesterday's value area and POC tells you whether the market thinks yesterday's fair value remains valid or if conditions have shifted to justify new value at different levels.
Combining Market Profile with Price Action

Market profile works best when combined with traditional price action analysis rather than used in isolation. Candlestick patterns gain more significance when they form at key profile levels like the POC or value area extremes. Support and resistance levels become more reliable when they align with high-volume nodes. The combination gives you both the structural context from profile and the precise timing signals from price action.
Using Profile Levels for Trade Timing
Market profile identifies the key levels where action is likely to occur, while candlestick patterns tell you when that action is actually happening.
Quick tip: When a hammer or bullish engulfing pattern forms right at the VAL or POC, you have confluence—volume-based support plus reversal pattern confirmation.
Quick tip: Shooting stars or bearish engulfing patterns at the VAH carry more weight because you have both resistance from the value area boundary and bearish price action confirmation.
Quick tip: Doji candles at the POC signal indecision at the fairest price—often precede breakouts in either direction as the market resolves the balance.
Quick tip: Large volume candles (wicks testing levels) at value extremes show rejection—the market tested outside value and participants pushed it back.
Entry and Exit Strategies
Combining market profile with price action provides specific entry and exit frameworks that improve timing and reduce risk.
Entry strategies using profile confluence:
-
Enter long when price pulls back to POC or VAL and shows bullish reversal pattern—buying at volume-based support with confirmation
-
Enter short when price rallies to POC or VAH and shows bearish reversal pattern—selling at volume-based resistance with confirmation
-
Enter breakout trades when price closes outside value area with strong candle and volume—trend continuation confirmation
-
Enter mean reversion trades when price opens far outside value and first hour shows rejection back toward VAH/VAL
-
Wait for price to test and hold at prior day's POC before entering direction of the hold—institutional level defense confirmed
Exit strategies using profile levels:
-
Take profit at opposite value extreme—bought at VAL, sell at VAH or POC
-
Exit when price reaches multi-timeframe POC confluence—higher timeframe resistance likely
-
Scale out as price approaches single print zones—inefficient areas where price may pause to fill
-
Exit if price closes outside value area in opposite direction—pattern failed, market rejecting your thesis
-
Trail stops using value area boundaries—exit if price closes back inside value after accepting outside it
Stop Loss Placement Using Profile Levels
Profile levels provide logical stop placement because they represent volume-based support and resistance rather than arbitrary price levels.
Stop placement guidelines:
-
Long positions entered at VAL: stop below the single prints beneath value area—if price trades through low volume zone, thesis broken
-
Short positions entered at VAH: stop above the single prints above value area—market accepting higher prices invalidates short
-
Trades entered at POC: stop on opposite side of value area—if POC fails to hold, price heading to opposite extreme
-
Breakout trades above value: stop below VAH—if price returns into value, breakout failed
-
Breakdown trades below value: stop above VAL—if price recovers into value, breakdown failed
-
Use prior day's POC as stop for overnight holds—institutional reference point that should hold if trend intact
Building Confluence
The power of combining market profile with price action comes from confluence—multiple independent factors agreeing on the same level or direction.
High-probability setups show: price approaching a key profile level (POC, VAH, VAL), candlestick reversal pattern forming at that level, volume confirming the reaction (increasing on the reversal), and prior price action showing that level has been respected before. When you have three or four factors aligning, the probability of the trade working increases substantially compared to taking trades based on profile or price action alone.
Single factor trades might work 50-55% of the time. Two factors aligned might get you to 60%. Three or more factors in confluence can push your win rate toward 65-70%. The market profile provides the structural context and key levels. Traditional technical analysis provides the timing signals and confirmation. Risk management using profile-based stops provides the framework for keeping losses small when you're wrong.
Remember: Market profile tells you where the market considers price fair and where volume concentrated, while price action tells you what's happening right now at those levels—combining them means you're trading with both structural context and real-time confirmation rather than relying on either approach in isolation.
Making Market Profile Work for You


Market profile gives you a window into institutional behavior by showing where the most trading activity occurred rather than just where price went. This volume-based perspective reveals fair value zones, support and resistance levels backed by actual transaction data, and the structural context that time-based charts miss. It's not a standalone system—it's a framework that enhances your existing analysis by adding the dimension of where participants were actually willing to do business.
Learning Curve and Integration
Market profile looks intimidating at first. The TPO letters, bell curves, and terminology feel foreign compared to the candlestick charts you're used to. That's normal. The learning curve is steeper than most technical analysis tools because you're learning to see the market differently—not just as price over time, but as volume distribution revealing participant behavior.
Start simple. Focus on understanding value area, POC, and the relationship between today's open and yesterday's value. Those three concepts alone provide actionable information without getting lost in complex profile shapes or auction theory. As you get comfortable with the basics, layer in concepts like single prints, value migration, and multiple timeframe analysis. Give yourself months to practice reading profiles, not weeks. The payoff comes from pattern recognition that develops over time as you see how price repeatedly responds to value area boundaries and POC levels.
Integration with your existing strategy matters more than replacing what already works. If you're a breakout trader, use market profile to identify when price is breaking out of value versus just making noise within it. If you trade mean reversion, use value area extremes as your reversal zones. If you're a trend follower, use value migration to confirm directional bias. The profile provides context and confirmation for whatever approach you're already using—it doesn't require abandoning your style.
The Bottom Line: Market profile trading shifts your focus from asking where price went to asking where the most volume occurred and what that reveals about institutional positioning—this volume-based perspective provides structural context and reference points that improve timing, reduce false signals, and help you understand whether the market is balanced and mean-reverting or trending and discovering new value at different levels.
