The Chart Guys have rolled out three cutting-edge indicators that are reshaping how traders approach the market. These are the BackBurner, TradeKeeper, and TrendScout. Tailored for those using TradingView, these indicators are now available for purchase, offering a fresh perspective on market analysis.
Understanding the Back Burner: Your Market Timing Ally
Imagine having a tool that tells you when to make your move in a trending market. This is what the Back Burner does. It's most effective in a market that's clearly moving up or down. For instance, in an uptrend, it looks for moments when the market dips briefly – these are your opportunities. Conversely, in a downtrend, it points out when the market briefly peaks.
Take the example of the company Meta. In a strong uptrend, Meta showed a pattern of pulling back and then bouncing back up. The Back Burner is designed to spot these moments. On March 28, 2023, for example, it signaled an optimal point on the hourly chart, which led to a significant rise in Meta's stock value. This tool is great for keeping your trading decisions cool and calculated, especially when you're worried about missing out on big moves.
The Trade Keeper: Guiding Your Trade Decisions
Think of the Trade Keeper as a smart assistant for your trades. While it's mainly used to figure out when to exit a trade, it can also help with deciding when to enter. It uses a variety of technical signals to keep an eye on the overall trend and alerts you if things might be changing.
Consider Tesla's stock movements. Using the Trade Keeper, you could have identified an entry point in January and stayed in the trade until the indicator suggested a potential shift in the trend. This strategy could have led to significant gains. Whether you're into fast-paced day trading or more measured swing trading, the Trade Keeper helps ensure you're making moves in sync with the market's rhythm.
Trend Scout: Mastering Multiple Timeframes
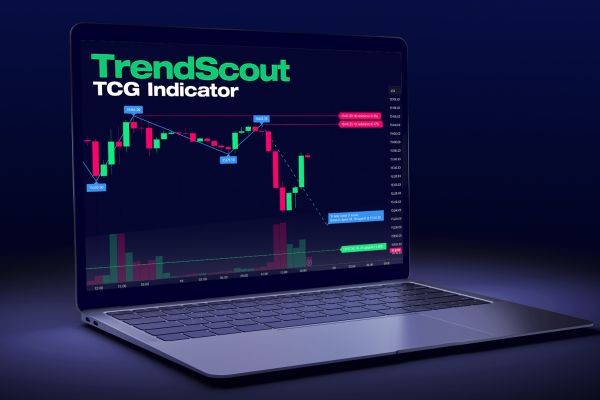
Created by Mark O'Sullivan, a trader with a background in software engineering, the Trend Scout is like a multi-lens camera for the stock market. It helps you see and understand trends across different timeframes – from a few minutes to a month. This broad view is crucial for making informed trading decisions.
For example, on a one-minute chart, the Trend Scout can highlight important trends and potential breakouts on a five-minute chart. This bigger picture helps you understand where the market might be heading next. For new traders, this is an invaluable tool for quickly getting a sense of the market's direction. For seasoned traders, it offers a quick, clear snapshot of multiple timeframes, making it easier to confirm their analysis.
Wrapping Up
The Back Burner, Trade Keeper, and Trend Scout from the Chart Guys are more than just indicators; they're your partners in navigating the complex world of stock trading. Whether you're trying to figure out the best entry and exit points, looking to stay in sync with market trends, or wanting to get a comprehensive view of market movements, these tools are here to help.
Disclaimer: This video transcript summary has been created or edited with the help of various AI tools.


