The Importance of the ETH/BTC Ratio
A ratio chart tells you whether a name has relative strength compared to a peer and this can greatly affect whether a trade works or fails, and if it does work, to what magnitude.
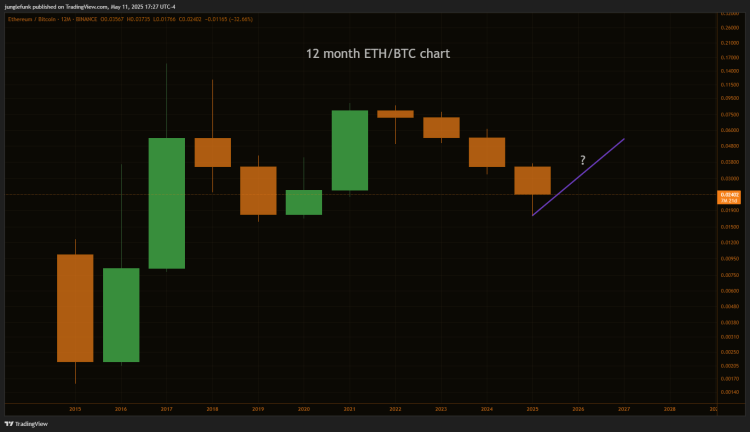
The ETH/BTC chart topped in December 2021 and since then, ETH has had it's back against the wall compared to BTC. At the time of writing this, BTC is up 50% from that date, and ETH is down roughly 50%, two starkly different performances.
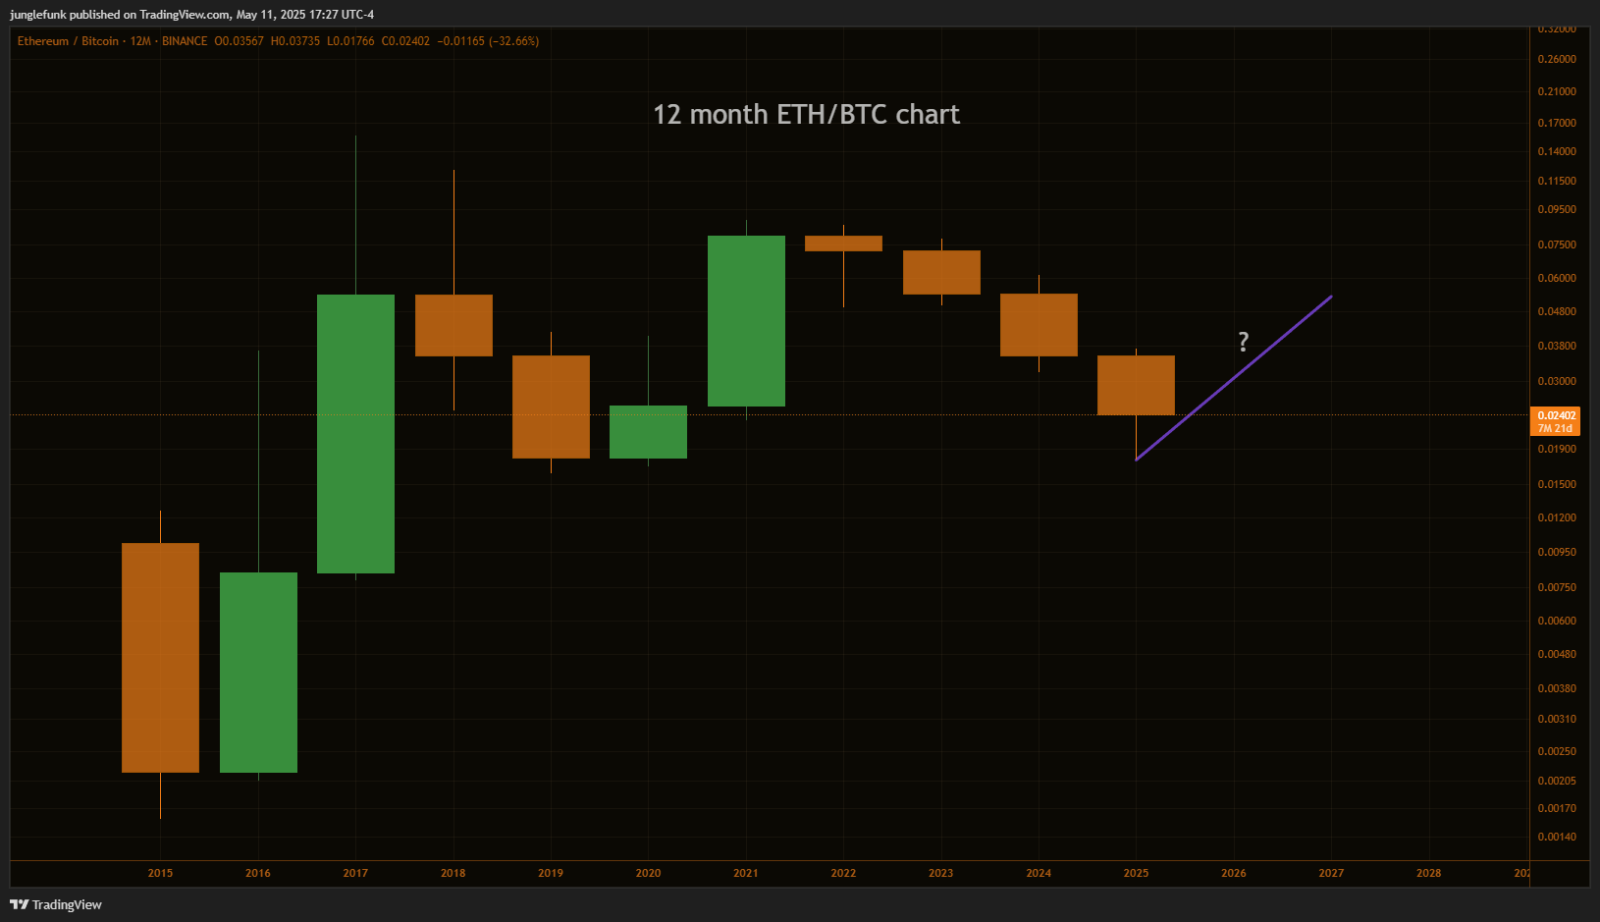
There are moments of outperformance for ETH mixed in there, such as the week of May 5th, 2025, but over the past 4 years those moves have been short lived. The ETHBTC ratio is currently testing yearly support, with bulls hoping that a bigger picture equilibrium. If this plays out, relative strength would come back into ETH in a more sustained sense.
What do ratio bulls need to do to make this happen? They need to confirm uptrends one timeframe at a time. First will be a weekly uptrend, second will be a monthly uptrend. If this can happen from here, then we will likely be seeing continued tightening on the yearly chart. If bulls fail to confirm uptrends yet again, then ETH will resume the less sensible place to keep capital compared to BTC.
From X (formerly Twitter)
this post marked the low on $ETHBTC
— junglefunk (@junglefunk_) May 8, 2025
gotta get over weekly 12ema as the next step towards shifting momentum bigger picture, for now still a weekly downtrend anticipating a weekly LH
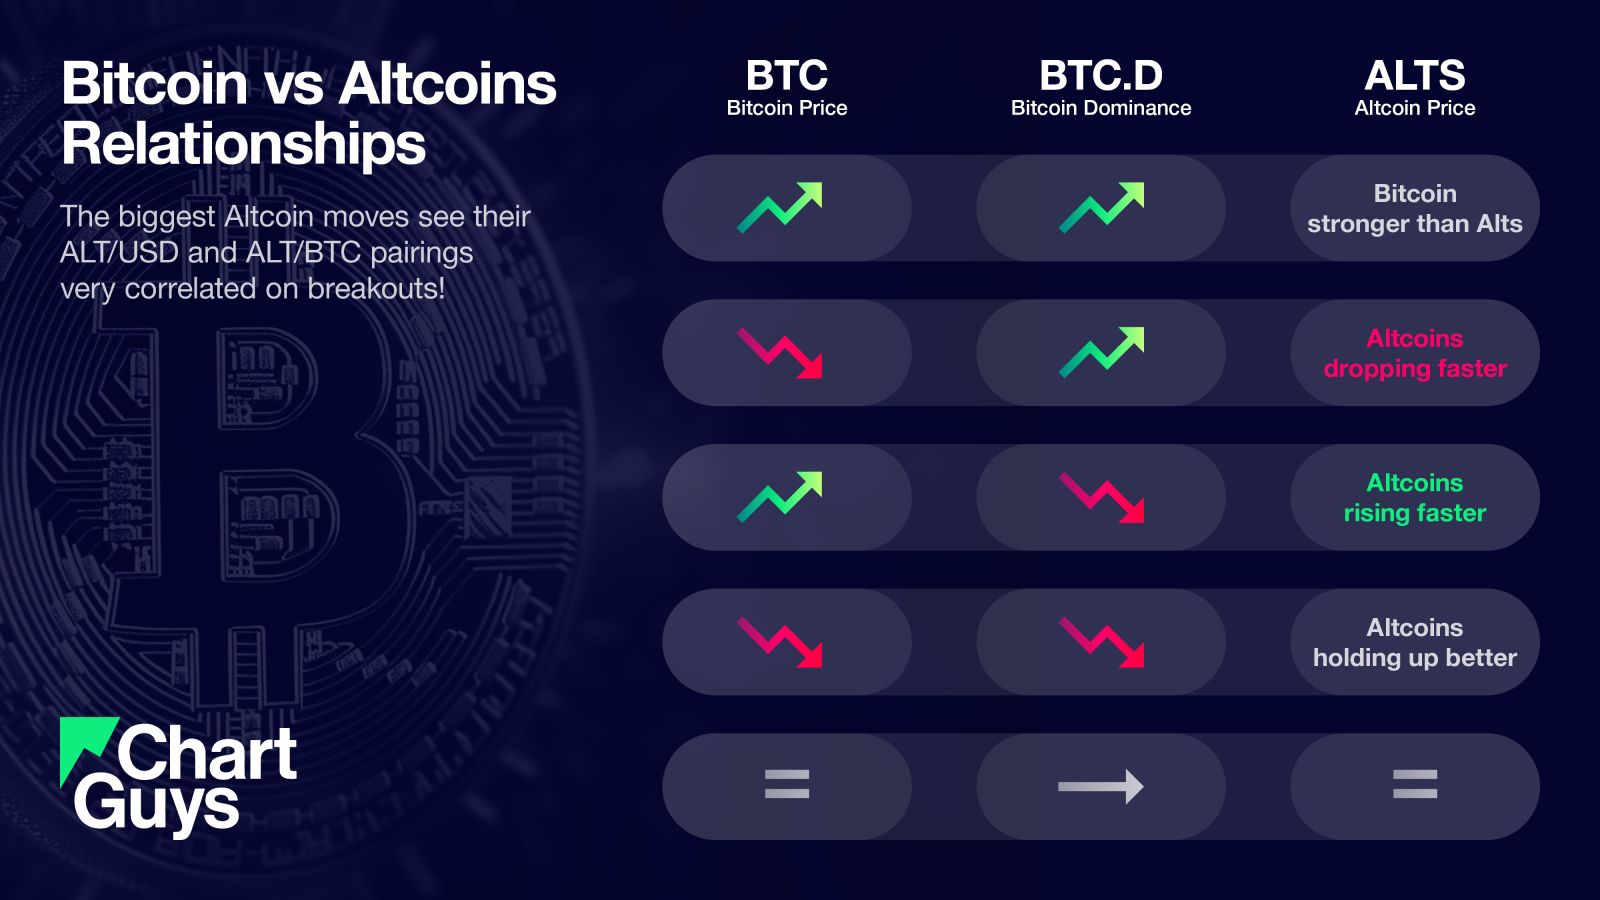
Clear difference in $ETH performance when the ratio is supporting the move https://t.co/V0wf36ufVB


