


TL;DR of the TTM Squeeze
The TTM Squeeze is a powerful tool and trading indicator developed by John Carter of Simpler Trading, that helps traders identify potential periods of low volatility followed by high volatility.
The TTM Squeeze combines three key components:
- Bollinger Bands
- Keltner's Channels
- A Momentum Indicator
Bollinger Bands are used to measure volatility, while Keltner's Channels are used to identify price breakouts. The Momentum Oscillator measures the speed of stock price movements.
When the Bollinger Bands move inside the Keltner's Channels and the Momentum Oscillator reaches a low level, it indicates a period of low volatility and a potential squeeze. This signals traders to prepare for a potential period of increased volatility and a potential breakout when the squeeze fires.
The TTM Squeeze has effectively predicted market trends and identified potential entry and exit points for traders. It provides valuable insights into market conditions and helps traders make informed decisions and is effective on multiple time frames. Overall, the TTM Squeeze is one of the great trading tools that helps traders visualize periods of low volatility and prepare for breakout periods and more ideal trading conditions.
Introduction to TTM Squeeze
The TTM Squeeze is a popular technical analysis tool that combines several key components to analyze market trends and identify potential trading opportunities. It uses Bollinger Bands to measure volatility, Keltner's Channels to identify price breakouts, and a momentum oscillator to gauge the strength of a trend.
The TTM Squeeze is designed to help traders spot periods of low volatility, which often precede strong directional moves in the market. When the Bollinger Bands move inside the Keltner Channels, it indicates a decrease in volatility, also known as a "squeeze." This signals a potential upcoming breakout, as the market is coiling up for a significant move.
Traders use the TTM Squeeze as part of their trading strategies to capture these breakout opportunities and profit from the ensuing price movements. By identifying periods of low volatility and anticipating potential breakouts, the TTM Squeeze helps traders align themselves with the prevailing market trends and capitalize on significant price moves.
Indicator Quick Facts
- The TTM Squeeze Indicator is a technical analysis indicator used by technical and professional traders to identify periods of consolidation range followed by potential breakouts in the market.
- This colorful indicator uses a combination of Bollinger Bands and Keltner Channels to detect squeeze signals, which indicate a tight trading range or a bit of consolidation, usually leading to a significant move in the market.
- Options traders value the TTM Squeeze for its ability to highlight moments when options premium experiences minimal premium decay, making it ideal for a bullish options strategy.
- Momentum components of the TTM Squeeze Indicator help in predicting the direction of the breakout, providing additional confirmation for successful trades, especially in directional trade scenarios.
- For day trading and longer-term trading plans, the TTM Squeeze Indicator serves as a crucial tool in a trader's trading arsenal and is available on many trading platforms.
- The indicator shines during periods of sideways price action, indicating market energy coiling up, which often leads to a significant move once the stock exits the tight trading range.
How the TTM Squeeze Works
The TTM Squeeze indicator measures both volatility and momentum to identify trading opportunities. It uses the Bollinger Bands to signal a squeeze condition, which occurs when the market becomes less volatile. This is indicated by the contraction of the Bollinger Bands, signifying a potential upcoming breakout or increase in volatility. Additionally, the TTM Squeeze incorporates the Keltner channel to further analyze volatility.
The color of the dots and histogram bars on the TTM Squeeze indicator also indicates the momentum direction. When the dots and bars turn green, it indicates a bullish momentum, while red indicates bearish momentum. This allows traders to identify changes in market sentiment and potential trading opportunities based on the direction of the momentum.
Interpreting the Indicator
Before a Trader properly utilizes the TTM Squeeze they must have a keen understanding of how to interpret the information presented. If they can understand the meaning behind the interplay of the indicators components they can gain insight into potential upcoming price movements and make more informed trading decisions. It can be a valuable tool for identifying potential breakout opportunities and for determining when to enter or exit a trade.
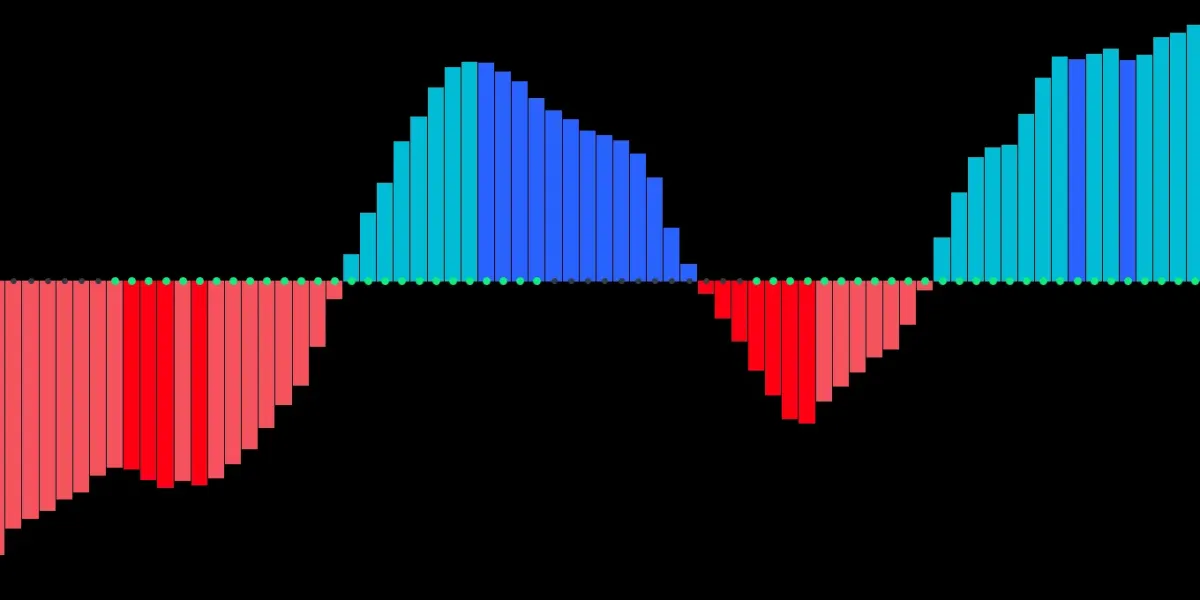
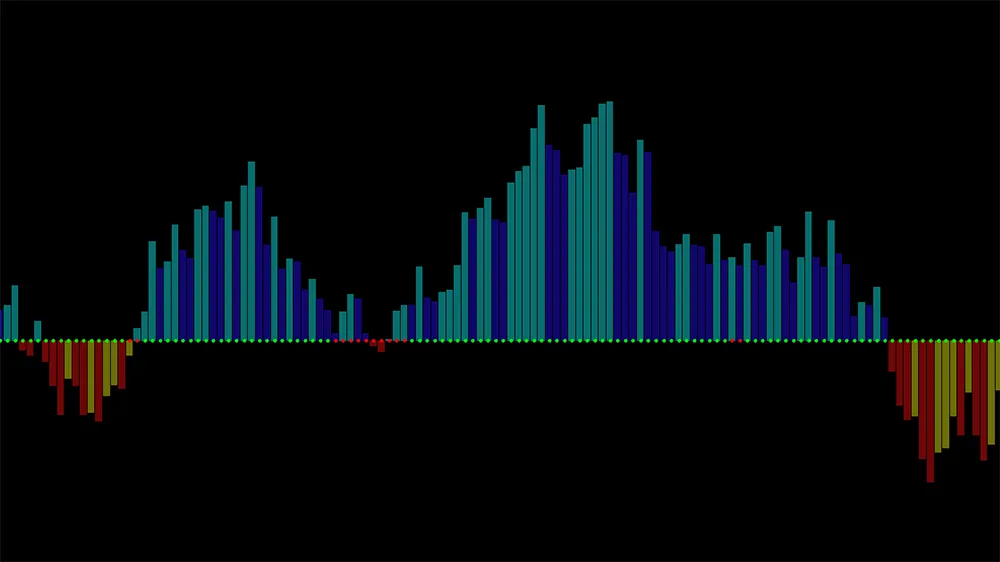
Four components of the TTM Squeeze
The TTM Squeeze indicator has four main components that help analyze an asset's performance and determine market momentum.
- Light/Dark Blue Bars: These histogram bars represent the momentum of the underlying bullish price action. When the indicator prints light blue bars, the bullish momentum is increasing. The indicator prints dark blue bars the momentum is decreasing.
- Light/Dark Red Bars: These histogram bars represent the momentum of the underlying bearish price action. When the indicator prints dark bars, the bearish momentum is increasing. When the indicator prints light red bars, the bearish momentum is softening.
- Keltner Channels/Bollinger Bands: Explained more thoroughly later in this article, these two indicators represent the volatility component to the TTM squeeze and they change based on overall price volatility and factor into the Red/Green dots.
- Red/Green Dots: The dots represent the presence or absence of squeeze conditions. When the Bollinger bands move inside the Keltner Channels, the dots are red. This indicates a lack of volatility and the presence of the "Squeeze". When the Bollinger Band moves outside the Keltner channel, the dot fires, and the Squeeze is activated.
By analyzing these components, traders can assess an asset's performance by identifying periods of low and high volatility, and use the squeeze firing to determine potential market direction.
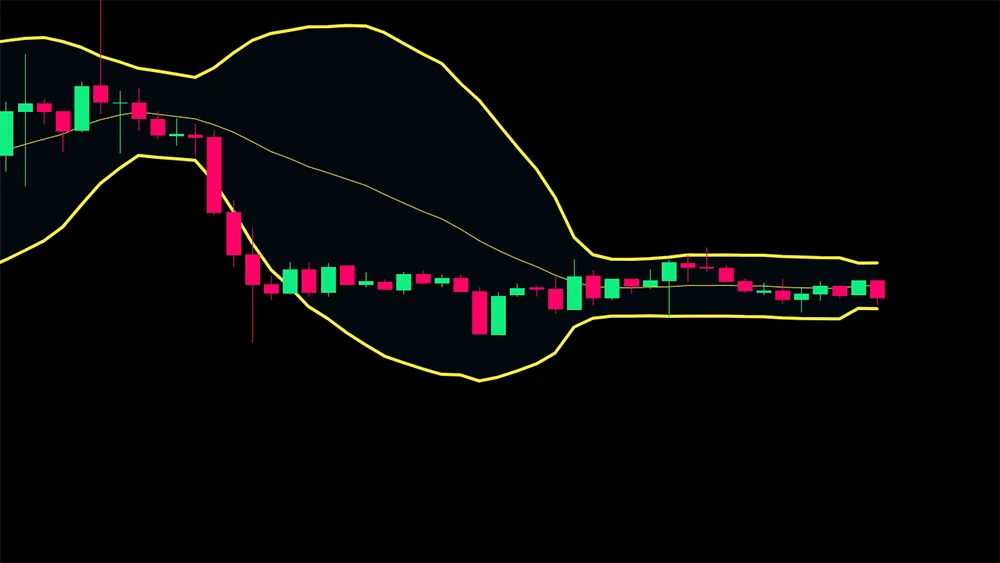
Combining Bollinger Bands and Keltner Channels
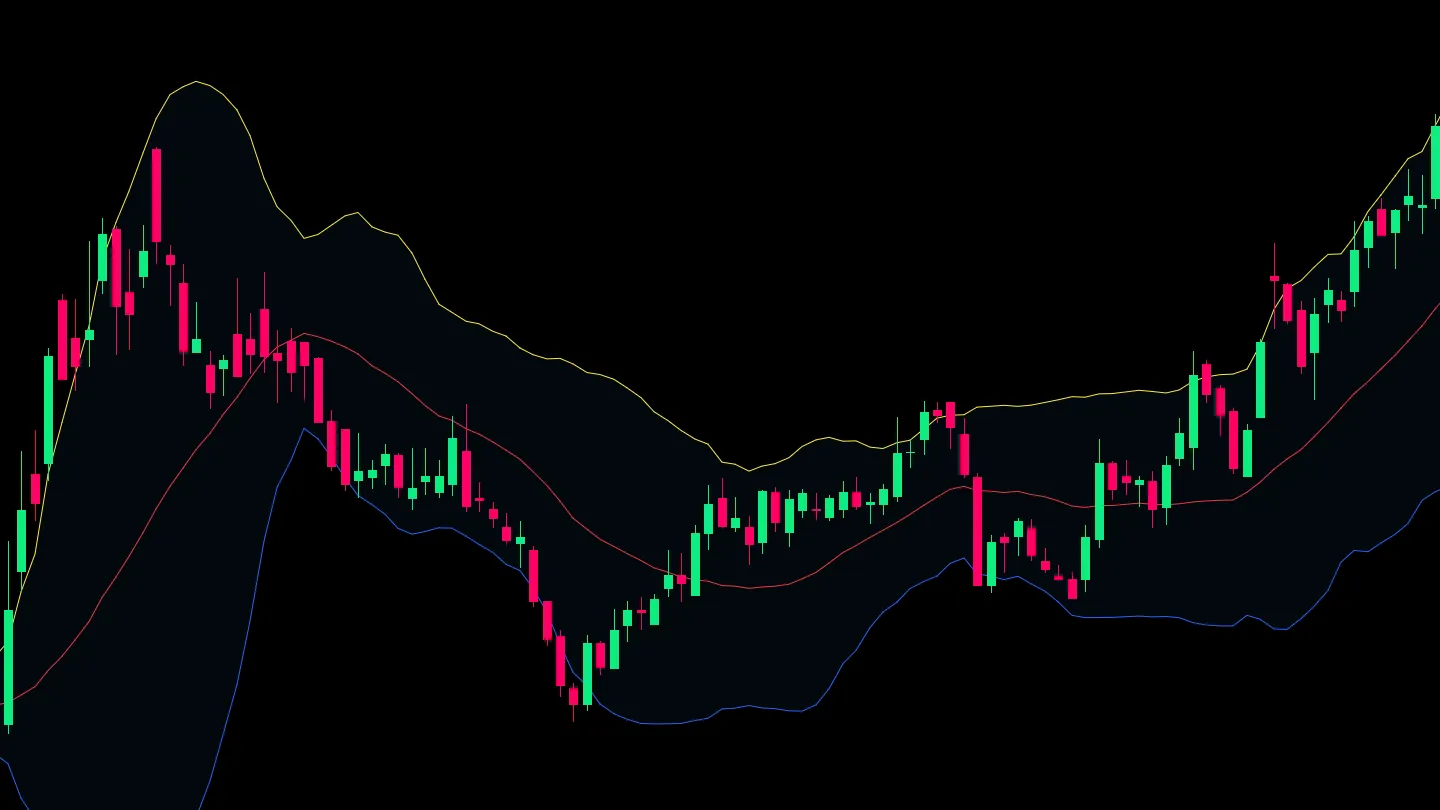
The TTM Squeeze combines Bollinger Bands and Keltner Channels to identify periods of low volatility and predict potential breakout trends in the market. Bollinger Bands measure volatility, with the upper and lower bands expanding during high volatility and contracting during low volatility. On the other hand, Keltner Channels measure the average true range, providing a more stable measure of price movement.
The TTM Squeeze uses these signals by identifying the periods when the Bollinger Bands are within the Keltner Channels, indicating low volatility and potential price consolidation. When the bands then start to expand outside of the Keltner Channels, it signals a potential breakout and the start of a new trend in the market. This combination of Bollinger Bands and Keltner Channels allows traders to anticipate potential opportunities for entering or exiting positions based on the expected increase in volatility and price movement.
In the example below the TTM consolidation period starts when the yellow Bollinger bands move inside the white Keltner channels. This results in the green dots flipping to red.
Understanding the use of Bollinger Bands
Bollinger Bands are a popular technical analysis tool used by traders to understand price volatility and identify potential price reversals. Created by John Bollinger in the 1980s, Bollinger Bands consist of a simple moving average and two standard deviation lines, creating a band around the price action. Understanding Bollinger Bands involves knowing how to interpret the width of the bands, the positioning of the price within the bands, and how they can be used in conjunction with other technical indicators to make informed trading decisions.
Bollinger Bands are a technical analysis tool that consists of a simple moving average and two standard deviations plotted above and below the moving average. The purpose of Bollinger Bands is to show the volatility and standard deviation move of a stock. The bands expand as volatility increases and contract as volatility decreases. Traders use Bollinger Bands to identify overbought or oversold conditions, as well as to spot potential trend reversals.
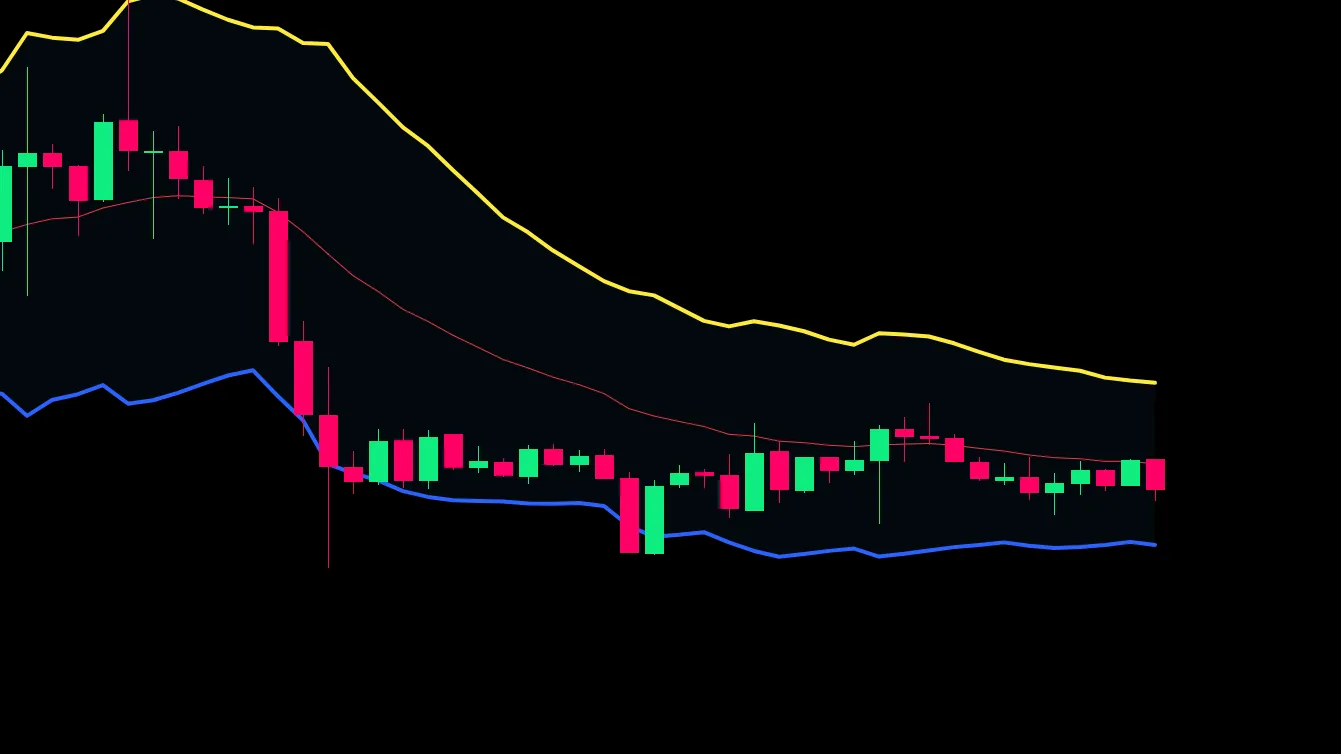
In the example below we can see the Bollinger bands contracting in response to the decreasing volatility in the market. This decreased volatility results in lower average ranges being factored in the Bollinger Band calculation.
Components of Bollinger Bands
Definition: Bollinger Bands are a popular technical analysis tool used to measure volatility and help investors identify potential overbought or oversold conditions in the market.
The calculation of Bollinger Bands involves three main components:
-
Simple Moving Average (SMA): The first step is to calculate the SMA of the security's price, typically using a 20-day period. This serves as the middle band (red)
-
Standard Deviation: Calculate the standard deviation of the security's price, which measures the price volatility. Standard deviation is a statistical measure that calculates the dispersion or variability of price data points from the mean (average).
-
Upper and Lower Bands: The upper (yellow) and lower (blue) bands are then determined by adding and subtracting the product of the standard deviation and a chosen multiplier (typically 2) from the SMA. This calculation results in two bands that are plotted two standard deviations away from the SMA.
Bollinger Bands provide insights into market volatility. When the bands widen, it indicates increased volatility, and when they narrow (known as the "squeeze"), it suggests decreased volatility. Traders often use these bands to gauge whether prices are relatively high or low on a relative basis.
Understanding the use of Keltner Channels
Keltner Channels, developed by Chester Keltner in the 1960s, are another technical indicator used by traders to help identify potential price trends and determine the optimum time to enter or exit a trade. These channels are based on the concept of volatility and consist of three lines: a middle line, an upper channel line, and a lower channel line. Keltner channels utilize the Average True Range (ATR) and the Exponential Moving Average (EMA) in the calculation of the three Keltner lines. By using the ATR, traders can gauge the strength of a trend and set the width of the channels accordingly. The EMA helps to identify the direction of the trend, and the three sets of Keltner Channels provide dynamic support and resistance levels, as well as potential entry and exit points based on the width of the channels.
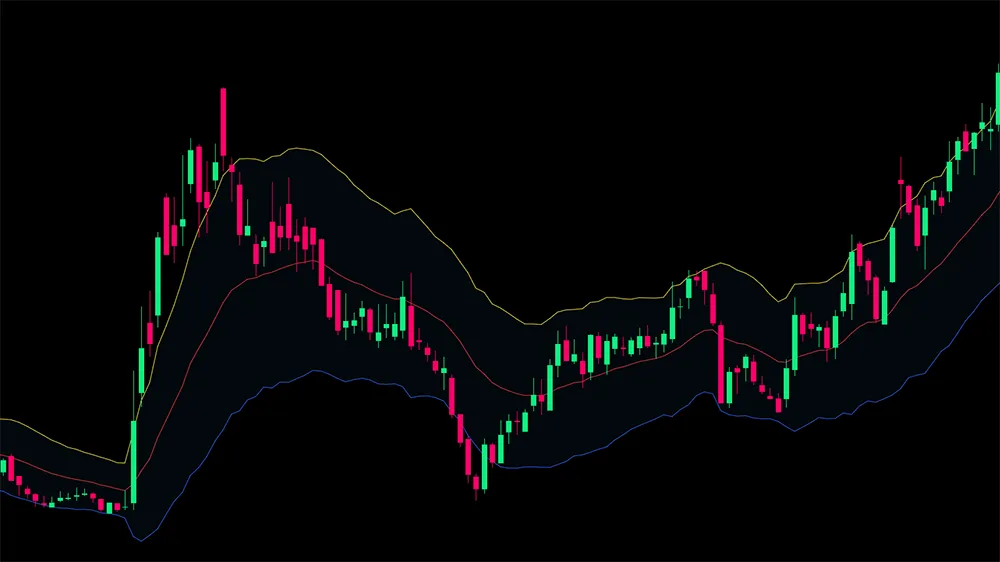
In the example below we can see the gap between the Keltner channels closing as a result of decreasing volatility.
Components of Keltner Channels
Keltner Channels are a technical analysis tool that attempts to identify trend direction and volatility in the market and is useful for timing entries and exits in the financial markets.
In this example, we can see the three Keltner lines, which serve the following purposes.
- Central Line (red): This is typically a moving average of the closing prices. The most common period used is a 20-day exponential moving average (EMA)
- Upper Channel Line (yellow): This line is plotted above the central line and represents a level of resistance. It is calculated by adding a multiple of the Average True Range (ATR) to the central line. The ATR is a measure of market volatility, and a common multiplier used is two times the ATR, added to the central moving average.
- Lower Channel Line (Blue): This line is plotted below the central line and represents a level of support. It is calculated by subtracting the same multiple of the ATR from the central line.
Traders use the Keltner Channel to spot moments when a stock or asset might start moving significantly, either up or down. If the asset's price climbs above the top line of the channel, it often means the asset is starting to trend upwards strongly, and it might be a good time to buy. On the other hand, if the asset's price falls below the bottom line, it's likely indicating a strong downward trend, suggesting it might be time to sell. The distance between the top and bottom lines of the channel can also tell traders about how unstable the market is; a bigger gap means more volatility, while a smaller gap means less.
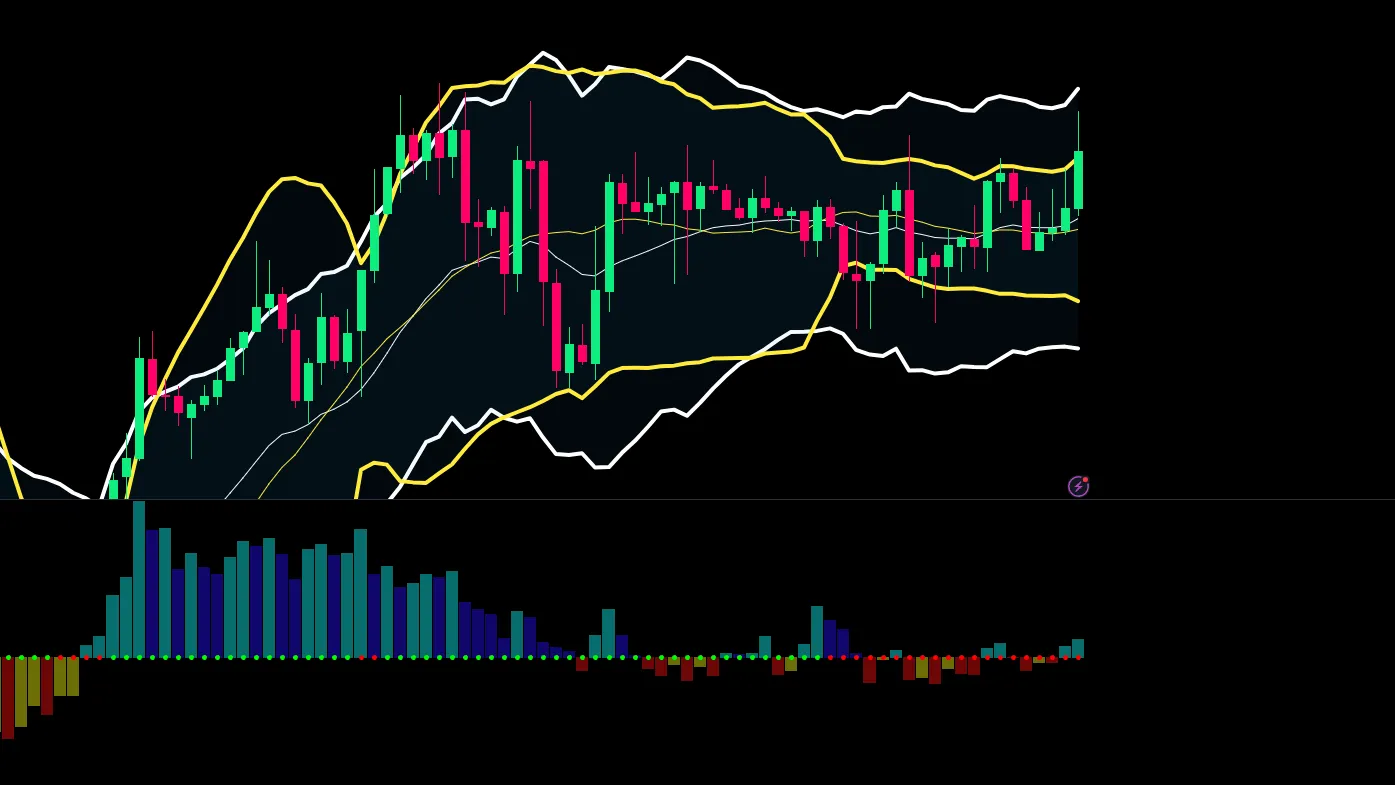
The TTM Strategy in Action
Talking about indicators and their components is important, but seeing the TTM Squeeze in action is where the real learning takes place. Let's walk through an example of the TTM Squeeze on the ticker MSFT. Below is the daily chart for MSFT, with the last candle printed being February 7th, 2024. In the preceding weeks, MSFT experienced a prolonged period of decreasing volatility that resulted in the tightening range of the Bollinger Bands, as indicated in yellow. Once the Bollinger bands constricted enough so that both the upper and lower bands were located inside the Keltner channels, the TTM consolidation period was activated. This occurred on December 8th, 2024, and is indicated by the red arrow. This period of consolidation continued until price action broke the daily resistance level, resulting in the expansion of the Bollinger bands, and the break of the lower band over the lower Keltner channel. This occurred on January 12th, 2024, where we see the green arrow indicating the flip from red to green dots, setting off the TTM squeeze breakout.

Wrapping it up
We've talked a lot about the different aspects of the TTM squeeze but lets focus on the key points. The TTM Squeeze is a tool that combines Bollinger Bands, Keltner's Channels, and a Momentum Indicator to do its magic. Bollinger Bands help see how calm or wild the market is, Keltner's Channels point out when prices are breaking out of their usual range, and the Momentum Oscillator tells us how fast prices are moving. When Bollinger Bands squeeze inside the Keltner's Channels and the momentum slows down, it's a hint that something big may be about to happen. Remember, no indicator is fool proof and the TTM Squeeze can provide just as many false signals as anything else so use it with caution.
