-
RSI Divergence is a crucial tool in technical analysis, signaling potential reversals or continuations in stock market trends.
-
For effective trading, RSI Divergence should be used in combination with other indicators and market analysis tools
-
Mastery of RSI Divergence can enhance decision-making in both short-term and long-term trading strategies.
-
Beginners should approach RSI Divergence with careful study, as its correct interpretation is key to successful market predictions.
An Introduction to RSI Divergence
Relative Strength Index (RSI) divergence is a technical analysis tool used by traders to identify potential trend reversals in the market. This divergence signals the measures of the magnitude of recent price changes to evaluate overbought or oversold conditions. When the price forms a trend moving in the opposite direction of the RSI indicator, it signals a potential divergence. This can serve as a warning sign of potential changes in the market trend leading to profitable divergence trades. Understanding and recognizing RSI divergence can be a valuable tool for traders looking to spot potential market reversals and adjust their positions accordingly. In this article, we will explore and briefly review the RSI indicator to understand how it functions. We will then jump into a discussion of the RSI divergence indicator in detail, including examples and walkthroughs.
RSI Divergence: What can it tell us?
RSI Divergence is a powerful tool for identifying potential price moves and trend changes. There are two types of RSI divergence: regular and hidden. Regular divergence occurs when the price makes a higher high, but the RSI indicator makes a lower high, indicating a potential trend reversal. On the other hand, hidden divergence occurs when the price makes a lower low, but the RSI indicator makes a higher low, signaling a potential trend continuation.
RSI Divergence occurs when the price movement and the RSI indicator move in opposite directions, signaling a potential reversal in the current trend.
For example, if a stock's price is making new highs, but the RSI is not confirming those highs by also making new highs, it may be a signal that the trend is weakening and a potential reversal could occur. Conversely, in the case of hidden divergence, if a stock's price is making new lows, but the RSI is making higher lows, it may suggest that the current trend is likely to continue.
By identifying RSI divergence, traders can make informed decisions about potential trend changes and adjust their trading strategies accordingly. This can help them to manage risk better and take advantage of profitable trading opportunities.
Overview of the Relative Strength Index (RSI)
Given that the RSI Divergence is built upon the use of the Relative Strength Indicator, we need to understand how that indicator works. The RSI is a popular momentum oscillator developed by J. Welles Wilder and is used by traders to identify extreme levels of overbought or oversold conditions in the market. It can be applied to a wide range of financial assets, including stocks, commodities, and cryptocurrencies. It measures the speed and change of price movements and provides traders with important signals for potential trend reversals or continuations. Understanding the RSI and its various applications can be an essential aspect of technical analysis and can help traders make informed decisions in their trading strategies.
How does the RSI Calculation work?
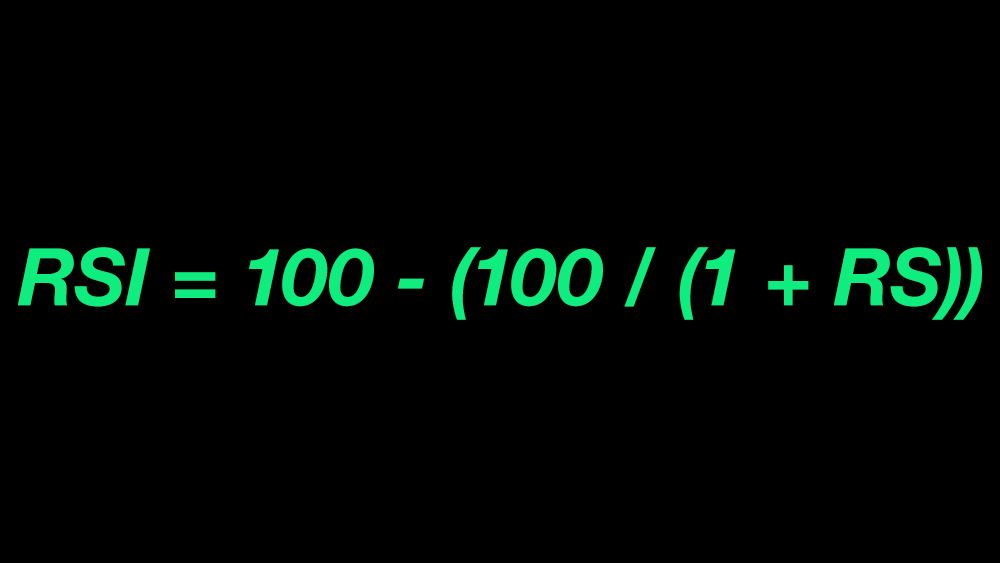
If you aren't a math person the following the RSI calculation may be confusing. It is worth spending the time to understand the why behind the indicators before you start to use them in your trading. The RSI is one of the more basic calculations, and it measures the speed and change of price movements. It is calculated using the following formula with default settings: RSI = 100 - (100 / (1 + RS)), where RS is the average of x days' up close / down close. RSI with modified settings may use a different number of periods for the calculation.

Market momentum refers to the strength and speed of price movements in a particular direction. RSI mirrors exchange rate movements by indicating whether a currency pair is overbought or oversold, which helps traders gauge potential trend reversals. Properly understood and integrated into a trader's tool it, the RSI provides valuable insights into market momentum and potential trend reversals, making it a useful tool for forex traders.
Interpreting RSI values
The Relative Strength Index (RSI) is a popular momentum oscillator that measures the speed and change of price movements. It ranges from 0 to 100 and is typically considered overbought when above 70 and oversold when below 30.
When analyzing RSI values, the position of the RSI line compared to the three areas of the indicator (overbought, oversold, and neutral) provides valuable insights. Understanding the 70/30 setting is important as it offers signals of extremes in price action. An RSI value above 70 indicates overbought conditions, suggesting a potential downturn in price, while an RSI below 30 indicates oversold conditions, suggesting a potential upturn in price.
The significance of the RSI crossing the 50 line is that it serves as a warning of a potential trend change. When the RSI moves above 50, it signals a strengthening of the current trend, and when it moves below 50, it suggests a weakening of the trend. This is an important signal for traders as it can help in identifying potential entry and exit points for trades.
Interpreting RSI values involves analyzing the position of the RSI line compared to the overbought, oversold levels, and neutral areas of the indicator, and understanding the 70/30 setting for signals of extremes in price action. Additionally, the crossing of the 50 line serves as a warning of a potential trend change. Don't forget, that like all indicators, the RSI can still provide a false signal and caution is warranted.
What is Divergence?
Divergence refers to the discrepancy between the price movement of an asset and an oscillator, typically a momentum indicator. Regular divergence occurs when the price of an asset creates higher highs or lower lows, while the oscillator shows lower highs or higher lows. This can indicate a potential reversal in price direction. On the other hand, hidden divergence occurs when the price creates lower highs or higher lows, while the oscillator shows higher highs or lower lows. This can signal a continuation of the current trend.
When aligned with support/resistance levels, divergence patterns can provide valuable insights into potential trend reversals or continuations. Regular divergence near a support/resistance level can indicate a possible reversal, while hidden divergence near these levels can suggest a continuation of the prevailing trend.
Divergence occurs when there is a disagreement between price and an indicator, signaling potential shifts in market sentiment. By identifying these patterns, traders can gain a competitive edge by anticipating potential market movements and making more informed trading decisions, ultimately leading to better market opportunities.
Importance of Divergence in Technical Analysis
Divergence is a crucial concept in technical analysis as it can provide valuable insights into potential shifts in the direction of a stock's price movement. By comparing the movement of price with an oscillator indicator, such as the MACD or RSI, traders can identify instances where the price of a stock is moving in the opposite direction of the indicator. This divergence can signal a potential reversal or change in the current trend, providing valuable information to enhance trading decisions.
When divergence aligns with key support or resistance levels, its impact on stock movement becomes even more significant. Divergence near support levels can indicate a possible bullish reversal, while divergence near resistance levels may signal a potential bearish reversal. When supported by other technical indicators, such as trend lines or moving averages, divergence can strengthen the potential for successful trading decisions.
RSI Divergence Quick Facts
- Integration with MACD: RSI Divergence, when used in conjunction with the Moving Average Convergence Divergence (MACD), can enhance the reliability of reversal predictions. While RSI divergence signals a potential reversal by comparing price action with momentum, MACD can provide further confirmation through its focus on the convergence and divergence of short-term and long-term moving averages.
- Refining Entry Points with Candlestick Patterns: Traders often use candlestick strategy patterns to refine entry points after identifying an RSI divergence. For instance, a bullish divergence on the RSI, coupled with a bullish candle on the candlestick chart, can offer a strong signal for entering a long position.
- Bollinger Bands for Volatility Assessment: Bollinger Bands can be used alongside RSI divergence to assess market volatility. A divergence occurring in a period of low volatility (narrow Bollinger Bands) can often lead to significant price movements, as the market may be consolidating before a breakout.
- Short-Term Trading Opportunities: RSI divergence is particularly popular among short-term traders, especially those using 15-minute or daily charts. This is because divergences can pinpoint potential short-term trend reversals, offering opportunities for traders to enter or exit positions based on expected price movements.
- Divergence in Strong Uptrends and Downtrends: RSI divergence can be particularly telling in strong uptrends or downtrends. For instance, if an asset shows a bearish RSI divergence during a strong uptrend, it may indicate that the uptrend is losing momentum, offering a potential opportunity for traders to prepare for a trend reversal.
How to Use RSI Divergence Trading Strategies
Having established the value and method of calculation for the RSI indicator, and the importance of divergence analysis we can now use this knowledge to determine when a bearish trend may develop or when we may see bullish trends appear. This is the application of RSI Divergence.
We have already established that RSI divergence occurs when the price of an asset moves in the opposite direction of the RSI indicator, signaling a potential reversal in the trend. Throughout the following explanation, it is important to remember that there are two types of RSI divergence - bullish and bearish.
The Bullish divergence pattern occurs when the price makes a lower low, but the RSI makes a higher low, indicating potential upward momentum. On the other hand, the bearish divergence pattern occurs when the price makes a higher high, but the RSI makes a lower high, indicating potential downward momentum. Understanding how to identify and interpret RSI divergence can provide valuable insights for traders and investors, helping them make more informed decisions when analyzing price trends and potential reversals in the market.
Bullish RSI Divergence Strategy
To identify bullish RSI divergences, start by finding a downtrend or a series of consecutive lower lows in the market. Next, look for a bullish divergence between the price and the RSI indicator. This occurs when the price is making lower lows, but the RSI is making higher lows. These oversold signals suggest a potential trend reversal from a downtrend to an uptrend.
Typically you would want to see additional confirmation in the form of reliable trading signals like strong bullish volume in the current candle. Other factors to consider include seeing the RSI tick back above 30 or histogram crossovers in the MACD.
At this point, you can consider the trade setup as having the highest success rate potential for this particular strategy and place your order. Failure of a strong green candlestick formation in the following periods should be considered a warning signal. Ensure you adhere to proper risk management practices and have a defined exit strategy and stop loss set to protect against even more extreme oversold market conditions.
Bearish RSI Divergence Strategy
To detect bearish RSI divergences, begin by locating an uptrend or a sequence of consecutive higher highs on the chart. Then, search for a bearish divergence between the price and the RSI indicator. This situation arises when the price is achieving higher highs, whereas the RSI is creating lower highs. These overbought indications hint at a possible trend shift from an uptrend to a downtrend.
It's generally advisable to seek further verification through trustworthy trading signals, such as substantial bearish volume in the current candle. Additional considerations might include observing the RSI dropping below 70 or experiencing histogram crossovers in the MACD.
Once these conditions are met, the trading setup may be deemed to have a heightened likelihood of success within this strategy, and you can proceed to place your order. A lack of a pronounced red candlestick pattern in subsequent periods should raise caution. It is crucial to practice sound risk management, including establishing a clear exit strategy and stop-loss measures to safeguard against further extreme overbought situations.
RSI Divergence Cheat Sheet
Now that you have a grasp on the fundamentals you can use this step-by-step cheatsheet to quickly identify trading opportunities.
Bullish Divergence Step by Step
Bearish Divergence Step by Step
Wrapping It Up
The key takeaway from this article is the importance of divergence in technical analysis. RSI Divergence, when used effectively, can be a powerful tool in a trader's arsenal, helping to identify potential trend reversals and make informed trading decisions. However, it's also crucial to remember that no single indicator is foolproof. Traders should use RSI Divergence in conjunction with other analysis methods and maintain sound risk management practices to navigate the complexities of the financial markets successfully.


