


Your Guide to the TradingView Platform
I don't think it's any secret that everyone on the Chart Guys team is a huge fan of the TradingView platform. We've been using it non-stop since we made the switch in 2016 and we've never looked back! I do not doubt that you've seen a variety of beautiful charts and indicators on our videos and perhaps you want to know how to get started. Well, this guide is for you! In this brief introduction, we'll teach you a little bit about what TradingView is, how you can get signed up, and a few of the different ways you can use the platform. Let's go!
What is TradingView?
TradingView platform is a comprehensive financial analysis tool that provides a wide range of features for traders and investors. It offers advanced charting tools allowing users to analyze the financial markets, looking for trends, patterns, and price movements. Real-time data availability ensures that users have up-to-the-minute information to make informed decisions. The platform also includes a plethora of technical indicators that can be used to perform in-depth analysis and develop trading strategies. There are some other very interesting features as well. TradingView provides an extensive news feed to keep users updated on the latest market developments and events and has a fantastic community aspect where users can share charts and live streams.
Overall, TradingView is a pretty amazing tool that can benefit both novice and experienced traders, providing them with the tools and information needed to make better trade decisions.
Importance of Using Charting Tools for Trading
Charting tools are essential for traders looking to make smart trade decisions based on price action, trends, and indicators. By using charting tools, traders can visually analyze the movement of prices over time, aiding in the identification of trends, momentum, volatility, and volume. This allows traders to develop successful trading strategies by understanding the underlying patterns and behaviors of the market. It all boils down to price action and psychology!
A great charting tool goes beyond providing a snapshot of the market. It allows traders to identify potential entry and exit points, as well as spotting potential reversals or continuation patterns. By incorporating these tools into their trading approach, traders can better manage risk and maximize potential returns.
Let's not forget our key levels! Charting tools can also help traders identify key support and resistance levels, which are crucial in determining potential price movements.
Getting Started with TradingView
With its intuitive interface and powerful charting tools, TradingView offers an accessible way to analyze and trade various markets, from stocks and forex to cryptocurrencies and commodities. In the remainder of this article, we'll walk you through the steps to get started with TradingView, from creating an account and setting up your charts to utilizing key features and finding trading opportunities.
Creating an account
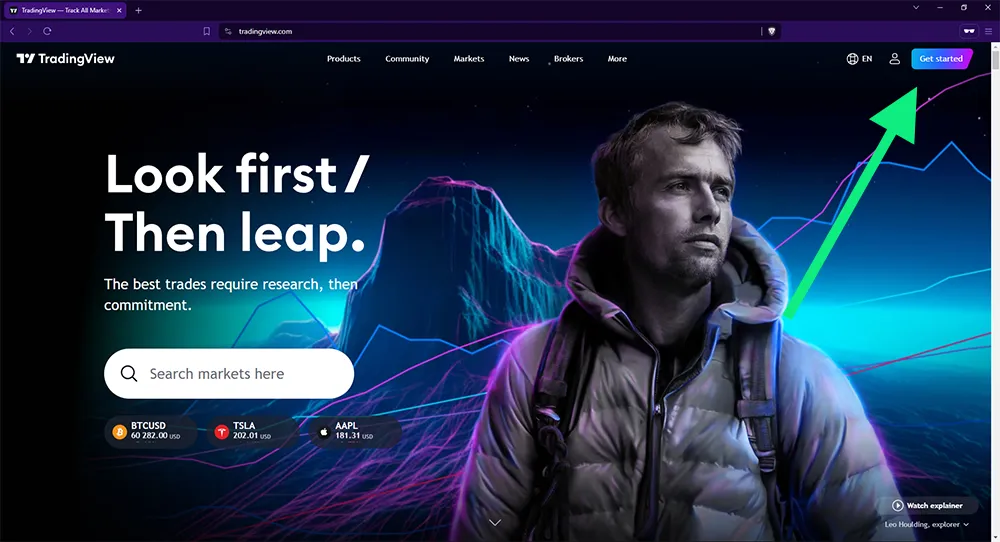
Creating a free account on www.tradingview.com is a simple process. Users can navigate to the website and click on the "Get Started" button in the top right. They will be prompted to enter their email address, choose a username, and create a password. Once the account is verified, users can access a range of free features, including the ability to create and save charts, use technical analysis tools, and access a limited selection of indicators and chart types. However, a free account comes with limitations, such as a small balance for paper trading and restrictions on the number of indicators and chart types available.
For those interested in practicing their trading skills without risking real money, TradingView offers a paper trading feature. This allows users to experience a realistic trading experience using virtual money. However, it's important to note that paper trading does have its limitations, and users should be aware of the differences between paper trading and real trading. To learn more about the benefits and limitations of paper trading, refer to the main article on the TradingView website. Users also have the option to reset their paper trading account to start fresh at any time.
Getting a Free Account with TradingView
To sign up on our platform, follow these simple steps:
1. Visit the TradingView platform's website and look for the "Get Started button".
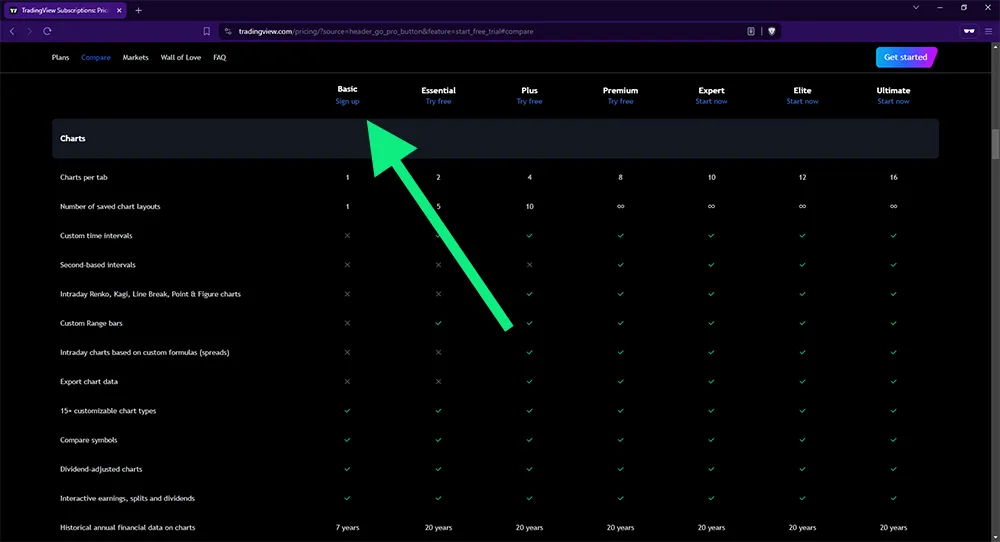
2. Scroll down and locate the "Compare Plans" button.
3. Follow the prompts to create the Free account. Choose a unique username that has not been taken by another user. Your username is how you will be identified on the platform.
4. Choose a strong password, which should include a combination of uppercase and lowercase letters, numbers, and special characters for security.
5. Complete any additional verification steps, such as email verification or phone number verification, to ensure the security of your account.
6. Once your account has been created, you may need to activate it by clicking on a confirmation link sent to your email.
7. All set!
Account types (free vs. premium subscription)
When choosing an account for a service or platform, it's important to consider the differences between free and premium subscription options. Each account type offers its own set of perks and limitations, and understanding these differences can help you make an informed decision about which option is best for you. Currently, the Free plan limits your charts per tab, and number of saved layouts, and restricts access to a variety of the features on the platform. That being said, it is still a great way to get your feet wet.
Using the TradingView Dashboard
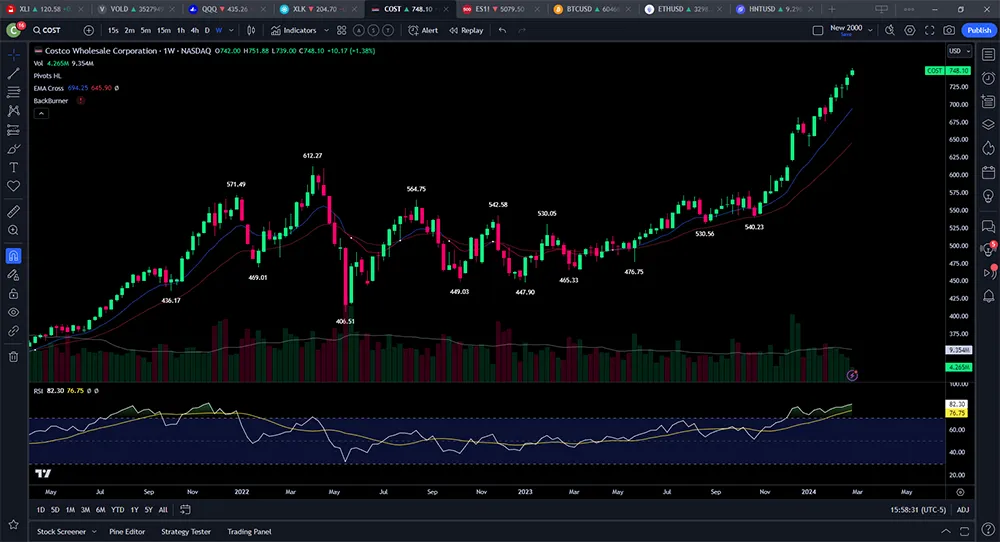
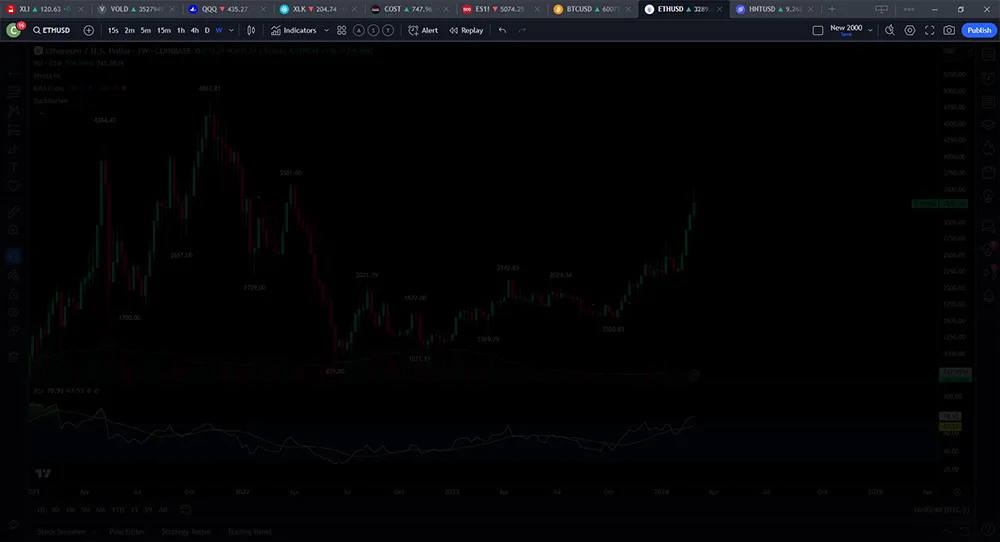
Navigating the platform is straightforward once you get the hang of it. Upon logging in to the super chart you will see that there is quite a bit going on, but we can break it down into five different sections.
Top Bar
On the very topmost part of the dashboard, you will see a banner-like section that contains a search box, a few different timeframes, chart types, and some additional menus for indicators. This section is all about finding the chart you want to look at, navigating to the correct timeframe, and applying different indicators to the chart. There are some more advanced options for indicators which we will discuss later, and some options for alerts and custom layouts.
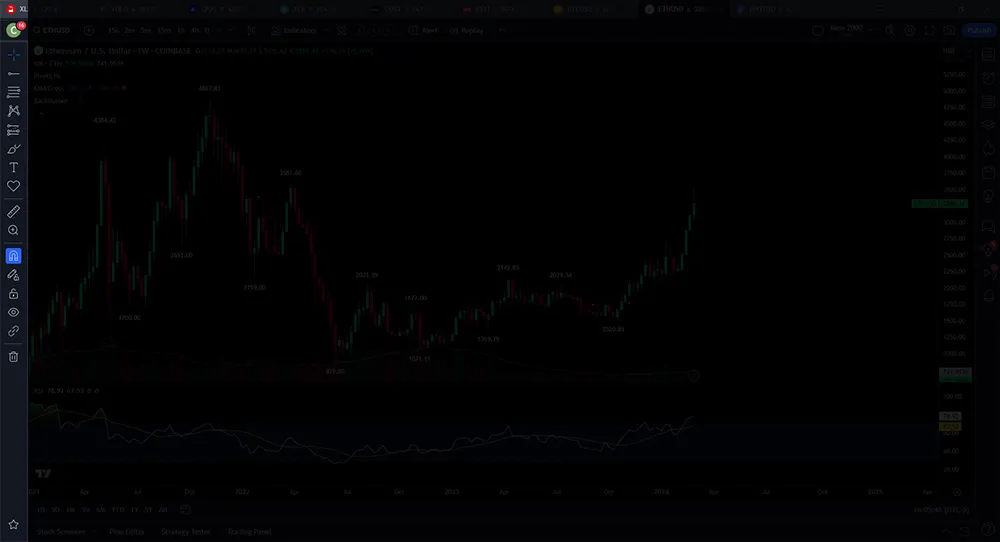
Left Hand Side
Here we find the goodies! Quite a bit to work with here, but this is where we find tools for drawing or otherwise marking up our charts. There are support resistance lines, Fibonacci levels, paint brushes, and more, all designed to help you make the most of the charts.
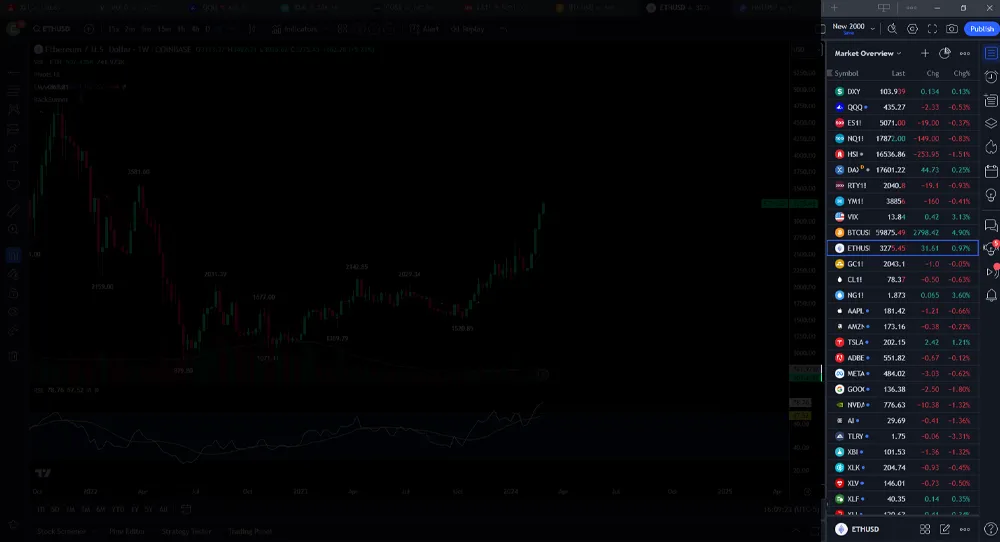
Far Right Side
On the opposite side of the dashboard, there is a rather large panel that can display quite a few different things. Most people use this space for their watch list, but it can also be the home for your order panel, chat, and community news feed. As you can see we also have 99 items to review in our Idea Stream, a TradingView-specific social network full of trading ideas.
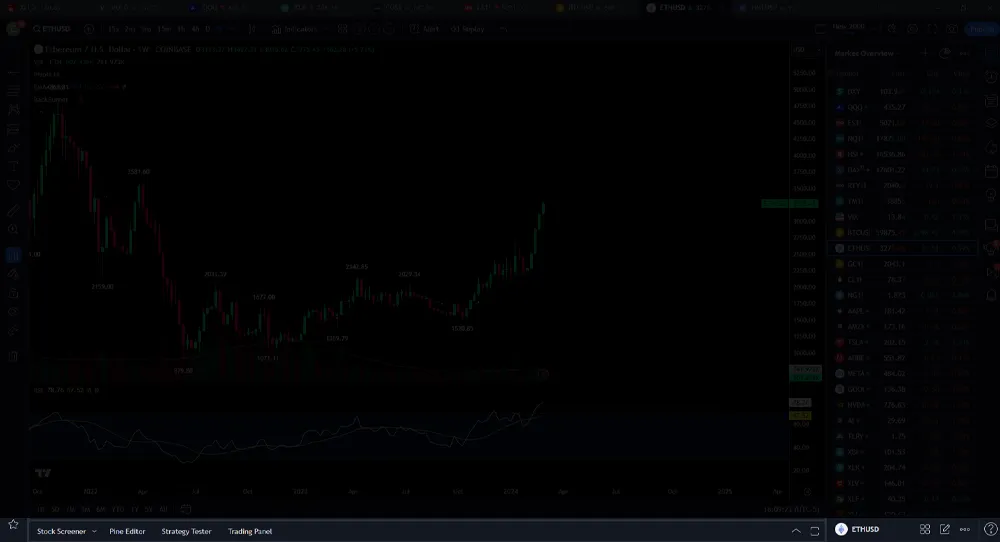
Bottom Panel
The bottom of the dashboard is dedicated to screeners, strategy testing, and indicator development. For new traders, there isn't much here to worry about. However! This is also the home of the trading panel, which is where you can hone your skills and track your trading performance with the paper trading function. Check out this link to learn all about paper trading on TradingView.
Central Chart
The star of the show, this section of the dashboard shows our charts in all of their glory, customized as much or as little as the heart desires. With almost infinite layout options and color themes, this is where we see our indicators and drawings come to life.
Choosing a Chart Type on TradingView
To choose a chart type on TradingView, start by clicking on the candlestick symbol at the top of the chart. This will open a dropdown menu with available options for chart types. You can choose from the traditional line and candlesticks, as well as more unique options like Renkos and Kagis. Renko charts use bricks to represent price movements, while Kagis use lines to show the direction of the trend. Additionally, TradingView offers a wide range of price chart types, including Point and Figure charts, which use Xs and Os to represent price movements. When choosing a chart type, consider the specific data you want to visualize and the level of detail you need. Selecting the right chart type is essential for understanding market trends and making informed trading decisions.
Line charts, bar charts, candlestick charts
The most common types of charts you will run into are line charts, bar charts, and candlestick charts.
To customize the chart settings, users can use the options available on TradingView. These options allow users to adjust the time frame, add technical indicators, change the color scheme, and customize the appearance of the chart. Users can also save their customized chart settings for future use.
- Line charts display the closing price over a set period and are useful for tracking overall price trends
- Bar charts provide more detailed information, showing the open, high, low, and close prices for each period.
- Candlestick charts also display the open, high, low, and close prices, but in a visually appealing format that helps users quickly identify market trends.
Using Technical Indicators on TradingView
When it comes to analyzing and predicting market movements, technical indicators really have a chance to shine. TradingView has a wide range of technical analysis tools, allowing users to visualize and interpret market data in real time. By utilizing technical indicators on TradingView, traders can make more informed decisions, identify potential entry and exit points, and develop effective trading strategies. On top of that you can learn to develop your trading indicators, as well as use custom indicators developed by other members of the TradingView community.
Adding Indicators to your Chart Layout
To add indicators to your price chart on TradingView, start by clicking on the "Indicators, Metrics & Strategies" button at the top of the screen. This will open a menu where you can select from a wide range of technical indicators to suit your trading needs.
From here you can click on Technicals and see and search through a list of the most popular built in and custom indicators.
Once you've selected your desired indicator, you can customize its settings by either clicking on its name on the top left corner of its panel or by right-clicking on it and choosing "Settings." This will allow you to adjust parameters such as period length, color, and style to tailor the indicator to your specific preferences.
By adding and customizing indicators to your price chart, you can gain valuable insights into market trends and potential trading opportunities. With the ability to add multiple indicators to your chart, you can create a comprehensive analysis of the market that suits your trading strategy.
The Most Popular TradingView Indicators
Popular indicators such as Moving Averages, Relative Strength Index (RSI), and Moving Average Convergence Divergence (MACD) are essential tools for analyzing market trends.
- Moving Averages: These traders identify the overall trend of ticker by smoothing out price fluctuations over a specific period. Popular are the 12 and 21 period moving averages
- RSI measures overbought or oversold conditions to determine potential reversal points.
- MACD, on the other hand, shows the relationship between two moving averages and helps traders identify trend changes.
To add these indicators to your chart, most trading platforms offer a simple process where you can select the indicator from a list and customize the settings according to your preferences. F
Wrapping Up
There is no doubt that TradingView has become an essential tool for members of the Chart Guys Community. By providing access to a wide range of technical indicators, charting tools, and real-time data, TradingView levels the playing field for all participants in the industry of retail trading. This democratization of access to advanced tools and resources enables traders of all levels to compete on a more equal footing, ultimately leading to a more transparent and efficient market.
