

Introduction
At the Chart Guys, Technical Analysis is the backbone of everything we do. We use Technical analysis, or TA, to strip out the noise, opinion, emotion and anything that clouds the purest form of information available. As a result Technical analysis has become an essential tool for us to navigate the world of financial markets. As the name suggests, it is an analytical approach that primarily focuses on the technical aspects of trading, such as price movements, volume, and chart patterns. But what is technical analysis? How does it differ from fundamental analysis? How can it help traders make informed decisions in the dynamic world of investing?
In this article, we aim to provide an introduction to understanding technical analysis and delve into its core concepts, methodologies, and applications in trading systems. We'll discuss the key principles that underpin this analytical technique and explore the tools and strategies used by technical analysts to forecast market trends and identify potential trading opportunities. From understanding the difference between technical and fundamental analysis to learning about charting techniques, technical indicators, and market psychology, this comprehensive guide will equip you with the foundational knowledge needed to embark on your journey into the realm of technical analysis. Whether you're a novice trader or an experienced investor, mastering the art of technical analysis can significantly enhance your decision-making process.
The Role of Technical Analysis in Trading and Investing

The role of technical analysis in technical trading strategies and investing lies in its ability to help market participants identify potential opportunities and make informed decisions based on historical price data and market trends. By analyzing past price movements, patterns, and trading volume, technical analysts can develop insights into the probable future behavior of financial instruments, such as stocks, commodities, or currencies. This information is invaluable in determining optimal entry and exit points for trades, setting stop-loss orders, and managing risk. Additionally, technical analysis can complement fundamental analysis by providing a more nuanced understanding of market sentiment and the psychological factors driving supply and demand.
Strengths and Weaknesses of Technical Analysis
Technical analysis offers a range of benefits and drawbacks that traders and investors should consider when making decisions in the financial markets. On the strengths side Technical Analysis provides a timely approach to market analysis, offering flexibility across various financial instruments. By using charts and quantitative methods, it offers an objective perspective, helping traders identify trends, entry and exit points, and manage risk. The self-fulfilling nature of technical analysis arises from the collective response of traders to specific signals or price levels.
With respect to Weaknesses, Technical analysis focuses primarily on price action, potentially leading to an incomplete understanding of the market. The interpretation of chart patterns and signals can be subjective, and the reliance on historical data assumes that past trends and patterns will persist in the future. Technical analysis may be less effective in illiquid or sideways markets and can lead to information overload due to the vast array of available indicators and tools.

Technical Analysis vs. Fundamental Analysis
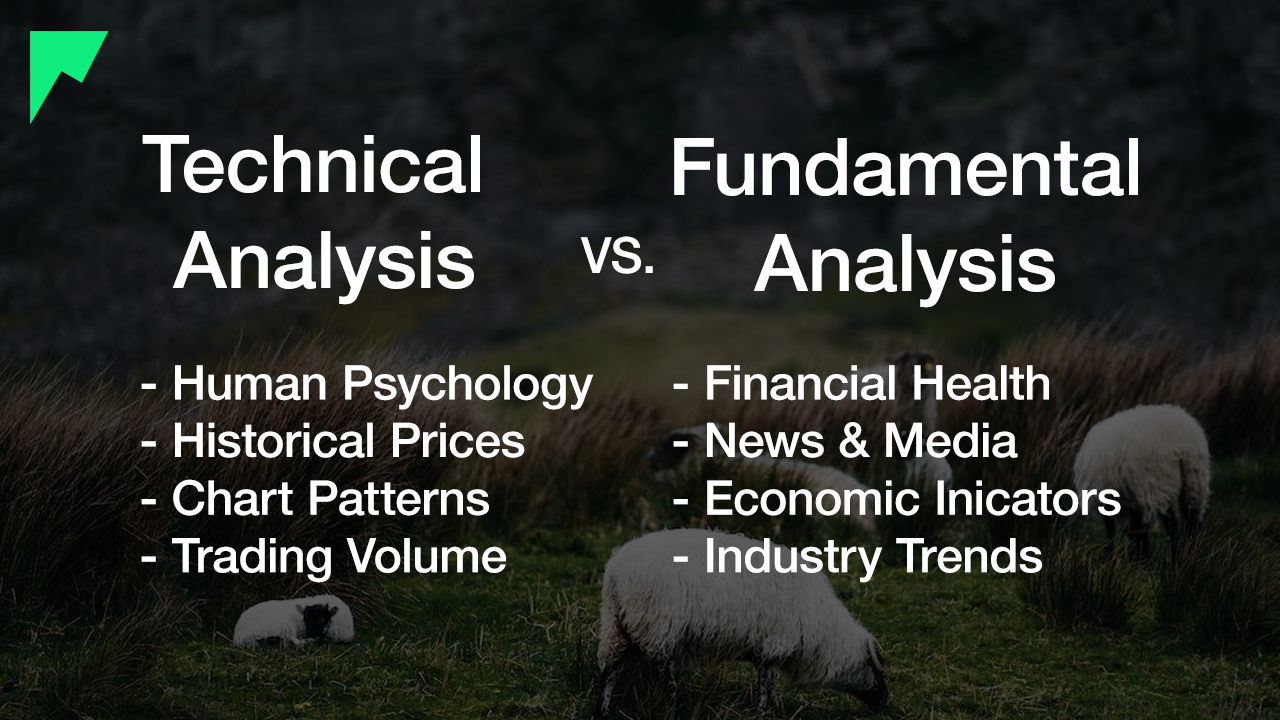
Technical analysis and fundamental analysis of are two distinct approaches to evaluating financial markets each with its own set of methodologies and objectives. Technical analysis focuses on the study of past price movements, patterns, and trading volume to forecast future market trends and identify potential trading opportunities.
In contrast, fundamental analysis examines the value of an asset by evaluating its underlying financial and economic factors, such as company performance, industry trends, and macroeconomic indicators. While technical analysis is primarily concerned with price action and market psychology, fundamental analysis seeks to determine whether an asset is overvalued or undervalued based on its financial health and growth prospects. Both approaches offer unique insights and can be used independently or in combination, depending on the trader's or investor's goals, time horizon, and risk tolerance.
Differences and Complementary Approaches
Technical and fundamental analysis are two distinct methodologies, each offering unique insights and objectives. While technical analysis primarily concentrates on historical price movements, chart patterns, and trading volume, fundamental analysis delves into a company's financial health and macroeconomic factors to determine its intrinsic value. The methodologies also differ, with technical analysts relying on price charts and indicators to make trading decisions, while fundamental analysts examine financial statements, economic indicators, and industry trends to assess an asset's value.
Despite their differences, these systems can be used as complementary approaches, providing a more comprehensive perspective on financial instruments and markets. By combining the strengths of both technical and fundamental analysis, market participants can develop more robust trading strategies and make well-rounded decisions. For instance, fundamental analysis can guide long-term investment strategy decisions and portfolio allocation, while technical analysis can provide insights into optimal entry and exit points for trades. Integrating both approaches lets you to adapt to changing market conditions and sentiment, as they can assess the impact of economic events, news, and market psychology on market prices and trend analysis. Embracing the differences and complementary aspects of technical and fundamental analysis can lead to improved risk management and a more holistic understanding of the forces driving stock prices.
Key Assumptions of Technical Analysis
Technical analysis assumes that market price reflects all available information, adhering to the efficient market hypothesis and that market prices move in trends with identifiable patterns that persist over time. It also assumed that history tends to repeat itself, as market participants often react in similar ways to recurring events, and that price and volume data are the most reliable indicators, providing valuable insights into the market's psychological and emotional state.
Past Price Information and Market Psychology
Past market price information and psychology are crucial components of technical analysis, as they help traders understand the behavior of market participants and predict potential future stock price movements. A Technical analyst believes that historical price data contains valuable insights into the market's collective actions. By analyzing past price patterns and trends, traders can identify recurring patterns and support/resistance levels that may influence future price movements. This approach is based on the idea that history tends to repeat itself, and market participants often react in similar ways to similar events or conditions.

The market's psychological and emotional state significantly impacts stock price movements, as fear, greed, and other emotions drive buying and selling decisions. Technical analysis seeks to understand the prevailing market sentiment by studying price and volume data. For instance, certain chart patterns, like head-and-shoulders or double tops, are believed to reflect shifts in market psychology, which can signal trend reversals or continuations. By identifying these patterns and gauging market sentiment, technical analysts aim to capitalize on psychological factors and make informed trading decisions.
Price Trends and Market Patterns
Price trends and market patterns play are used in technical analysis, as they provide valuable insights into the market's direction and potential future movements. Technical analysts believe that stock prices tend to move in trends, either upwards (bullish), downwards (bearish), or sideways (consolidation). Identifying the prevailing trend is a critical aspect of technical analysis, as it helps traders make informed decisions about when to enter or exit positions. Trading in the direction of the trend is considered a key principle in technical analysis, as it often increases the likelihood of successful trades.
Market patterns, such as basic chart patterns and candlestick patterns, are graphical representations of price movements that often exhibit recurring behavior. These patterns are used to identify potential trend reversals or continuations, as well as entry and exit points for trades. Technical analysts study market patterns to gain insights into the market's collective psychology, which can help predict future price movements.
Relevance of Trading Volume
Trading volume provides essential context for price movements and offers insights into the market's underlying strength and sentiment. The relevance of trading volume used in technical analysis can be summarized in the following ways:
- Confirming price trends: Trading volume helps validate the legitimacy of a price trend. A rising trend with increasing volume indicates strong buying interest and conviction in the market, suggesting that the trend is likely to continue. Conversely, a rising trend with decreasing volume might signal weakening momentum and a potential trend reversal.
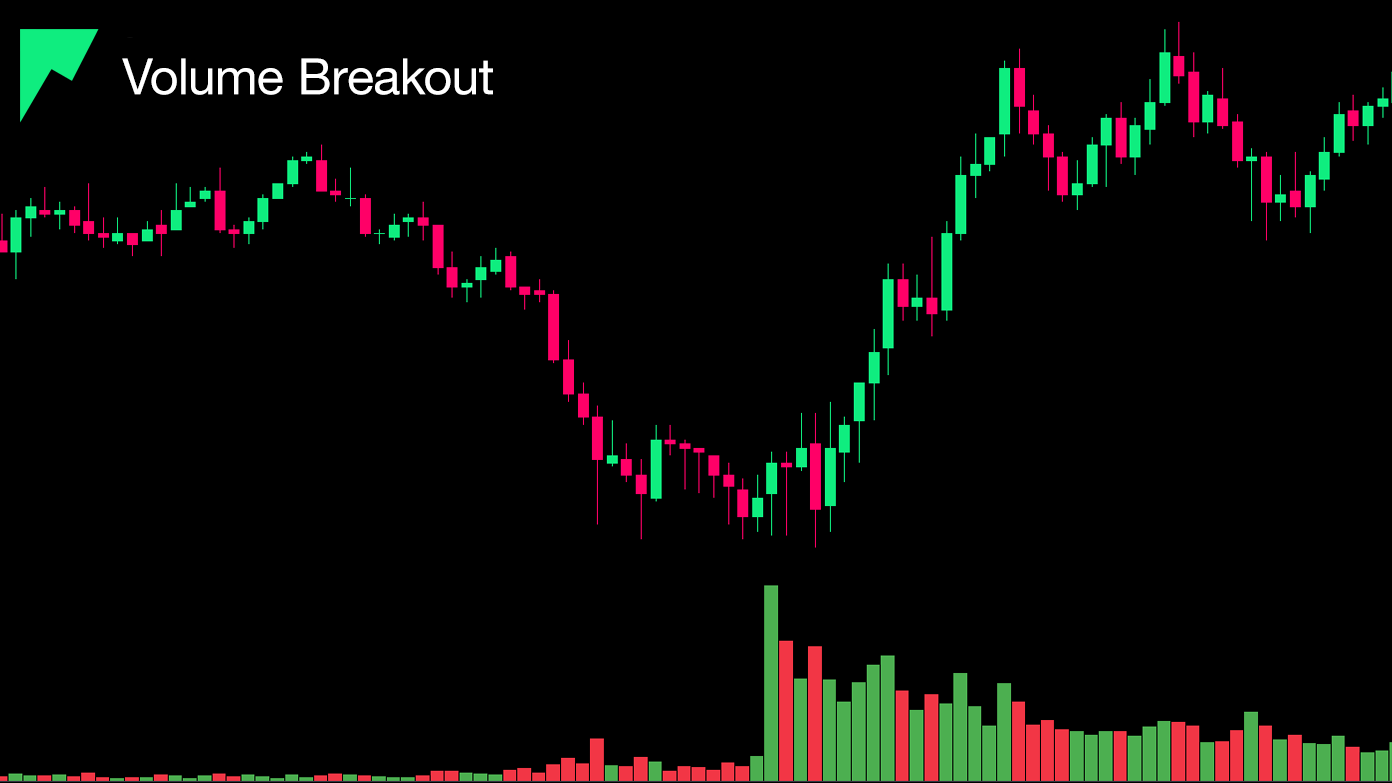
- Identifying breakouts: High trading volume accompanying a price breakout from a consolidation pattern, such as a triangle or a trading range, can signal a strong shift in market sentiment. This increased volume may confirm the breakout's validity and indicate the potential for a sustained move in the breakout's direction.
- Assessing trend reversals: Changes in trading volume can provide early clues about trend reversals. For example, if a stock's price declines on decreasing volume, it may signal that selling pressure is subsiding, and a trend reversal could be imminent. Similarly, a sudden spike in volume during a downtrend might indicate panic selling or capitulation, potentially marking a bottom.
- Analyzing market interest: Trading volume can help gauge the market's interest in a particular security. A stock with consistently high trading volume tends to attract more market participants, offering increased liquidity and potentially more predictable price movements. In contrast, low trading volume may indicate a lack of interest and less reliable technical signals.
Charting Techniques in Technical Analysis
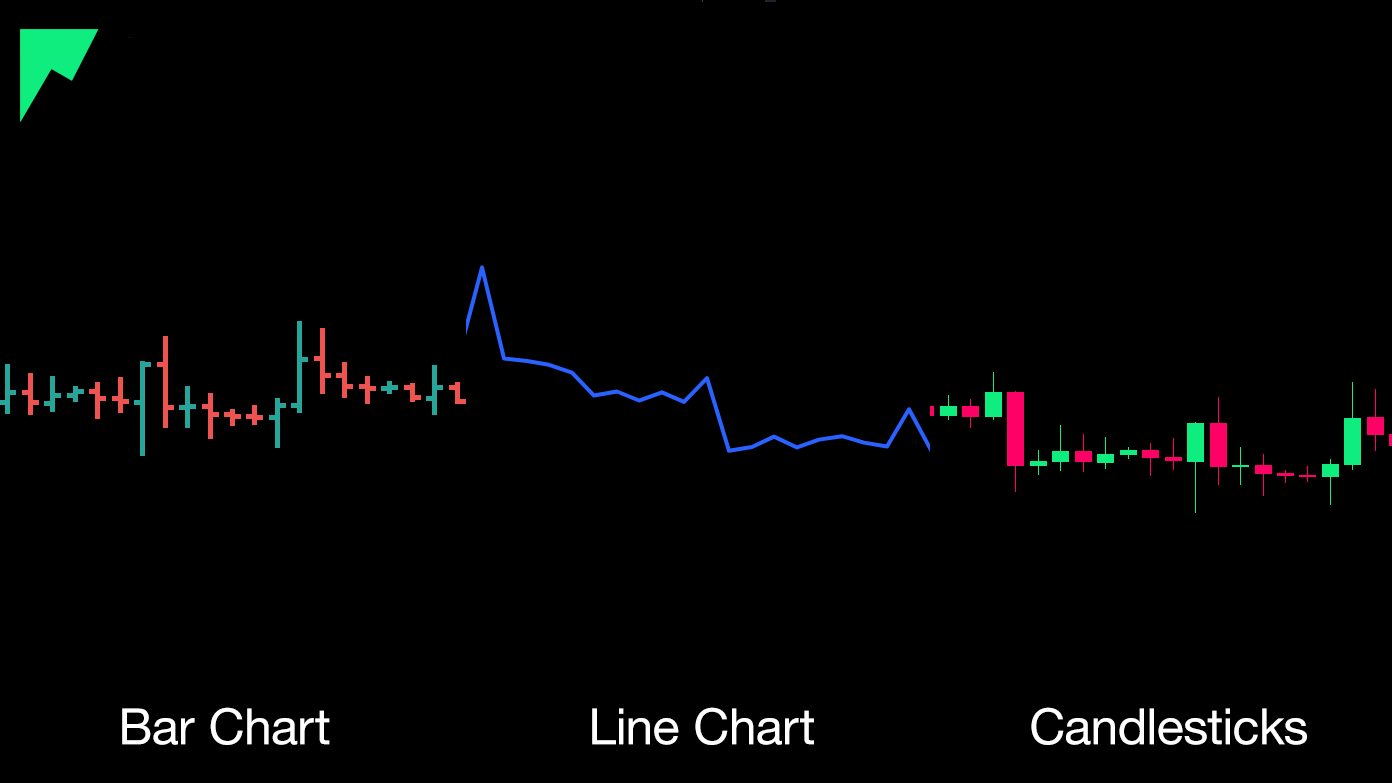
There are three primary charting techniques in technical analysis, line charts, bar charts, and candlestick charts. Each chart type provides a unique perspective on market dynamics, offering valuable insights into trends, support and resistance levels, and price patterns.
Line Charts
Line charts are one of the most basic and commonly used chart types in technical analysis, representing the progression of an asset's price over a specified period. They provide a clear and simple way to visualize price movements, helping traders identify trends and support/resistance levels.
A line chart is created by connecting the closing prices of an asset over a given time frame with a continuous line. The horizontal axis represents the time, while the vertical axis represents the price. The choice of time frame depends on the trader's preferences and can range from intraday to weekly, monthly, or even longer periods.
Bar Charts
Bar charts are a popular chart type in technical analysis, providing a more detailed view of price movements compared to line charts. They convey essential information about an asset's open, high, low, and close (OHLC) prices for a specified time period, making it easier to analyze market dynamics and make informed trading decisions.
A bar chart consists of vertical bars, with each bar representing a single time period (e.g., 1 hour, 1 day, 1 week). The top of the bar indicates the highest price during that period, while the bottom represents the lowest price. A small horizontal tick on the left side of the bar shows the opening price, and another tick on the right side denotes the closing price.
Candlestick Charts
Candlestick price charts offer a visually intuitive representation of price movements and convey important information about an asset's open, high, low, and close (OHLC) prices for a specified time period, similar to bar charts. Candlestick charts also incorporate color coding to quickly convey the market's direction and sentiment.
A candlestick chart consists of individual candlesticks, each representing a single time period (e.g., 1 hour, 1 day, 1 week). A candlestick has two main components: the body and the wicks (or shadows). The body represents the range between the opening and closing prices, while the wicks extend from the body to the highest and lowest prices of the period. Candlesticks are typically color-coded, with a specific color (usually green or white) for a bullish period where the closing price is higher than the opening price, and another color (usually red or black) for a bearish period where the closing price is lower than the opening price.
Price Patterns and Time Frames
Price patterns and time frames help traders analyze market dynamics and make informed decisions based on historical price data. Each element plays a distinct role in understanding the market's behavior and anticipating future price movements.
Price patterns are recurring formations on a price chart that can provide insights into potential trend reversals or continuations. A technical analyst will study these patterns to identify trading opportunities and gauge market sentiment.
Time frames refer to the duration of each data point on a chart, such as 1-minute, 1-hour, 1-day, or 1-week intervals. The choice of time frame depends on the trader's preferences, trading style, and objectives. Different time frames can provide unique perspectives on price action and help traders identify short, intermediate and long term stock trends.
Support and Resistance
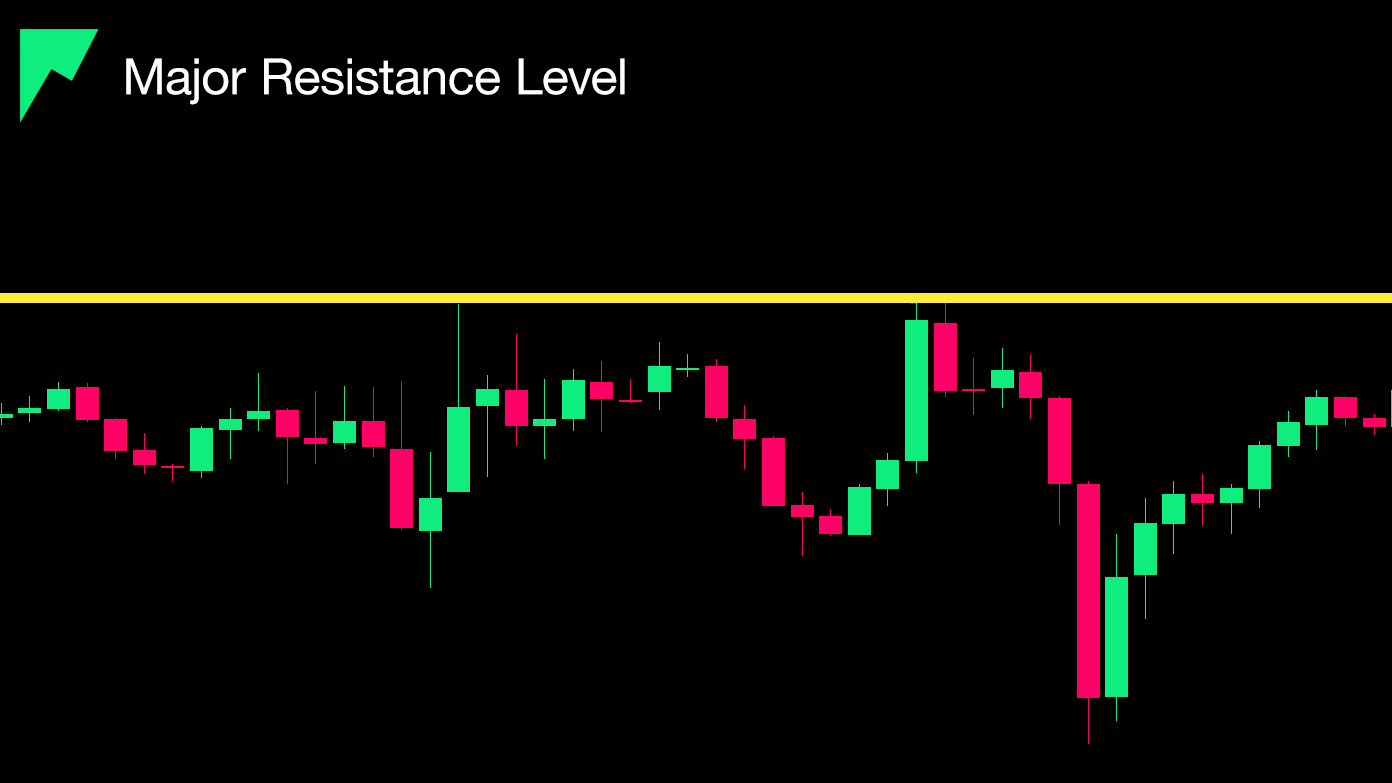
Support and resistance represent key price levels where buying or selling pressure tends to prevent further price movement. These levels serve as a framework for understanding market psychology and inform various aspects of trading, such as identifying reversal points, confirming trends, establishing price targets, managing risk, and analyzing price patterns. When prices approach support or resistance levels, traders anticipate potential reversals or breakouts, using these levels to set entry and exit points as well as stop-loss orders. Additionally, support and resistance levels often form the boundaries of chart patterns.
Technical Indicators and Tools
Technical indicators and tools are widely used in technical analysis to interpret price data, identify trends, and gauge market sentiment. Some key technical indicators and tools include momentum indicators, moving averages, and Fibonacci Retracements and Extensions.
Momentum Indicators
Momentum indicators help traders assess the strength of a price movement and identify potential trend reversals or continuations. They measure the rate of change in an asset's price and are typically displayed as oscillators. Some popular momentum indicators include the Relative Strength Index (RSI), the MACD (Moving Average Convergence Divergence)
Moving Averages
Moving averages help smooth out price data to identify trends and potential support or resistance levels. They are calculated by averaging the asset's closing prices over a specific time period.
Simple Moving Averages (SMA) are calculated by adding the closing prices for a set number of periods and then dividing the sum by the number of periods. It gives equal weight to each price point in the calculation.
Exponential Moving Averages (EMA) place more weight on recent prices, making it more responsive to recent price changes. It is calculated by adding a percentage of the current price to a percentage of the previous EMA.
Fibonacci Retracements and Extensions
Fibonacci tools are based on the Fibonacci sequence, a mathematical series of numbers found throughout nature. They are used to identify potential support and resistance levels and predict potential price targets.
Fibonacci Retracements are used estimate how much of a recent price movement will retrace before the trend resumes. Key retracement levels are typically drawn at 23.6%, 38.2%, 50%, 61.8%, and 78.6%.
Fibonacci Extensions are used to help traders project potential price targets beyond the end of a trend or following a retracement. Key extension levels are often drawn at 127.2%, 138.2%, 161.8%, and 261.8%.
Learning Technical Analysis
Learning technical analysis effectively involves several key steps. Start by familiarizing yourself with core concepts such as support and resistance, trends, chart patterns, and price action to build a solid foundation. Study different types of price charts, to better visualize and interpret market data. Research various technical indicators and tools, like momentum indicators, moving averages, and Fibonacci retracements/extensions, to enhance your trading decisions.
Enrich your understanding of technical analysis by reading books and articles, taking online courses, and attending workshops. Practice your skills using a demo trading account, which allows you to apply technical analysis in real-time market conditions without risking real money. Engage with trading communities through online forums, social media groups, or local meetups to gain valuable insights, feedback, and support.
Stay updated with market news and economic events to understand how real-world events can impact technical analysis and price action. Regularly review your past trades to identify areas for improvement and learn from your successes and failures. Finally, be patient and persistent, as learning technical analysis takes time and dedication. By following these steps, you can develop a strong foundation in technical analysis and improve your ability to make informed trading decisions.
Key Considerations and Resources
When learning technical analysis, it's essential to understand the fundamental principles, such as the idea that price action reflects all available information, prices move in trends, and history tends to repeat itself. Familiarize yourself with various charting tools, technical indicators, and analysis techniques, and select those that best align with your trading style and objectives.
Use a diverse range of resources, such as books, articles, online courses, and webinars, to gain a comprehensive understanding of technical analysis. Establish a clear trading plan that outlines your goals, risk management strategies, and preferred trading techniques. Practice regularly with a demo account to hone your skills and continuously refine your techniques and strategies based on your trading experiences.
Complement technical analysis with other disciplines, such as fundamental and sentiment analysis, to gain a holistic understanding of the market. Develop a disciplined approach to trading by setting clear rules for entry, exit, and risk management, and consistently adhering to them. Stay flexible and adapt your technical analysis strategies to changing market conditions.
Understand that losses are a part of trading, and focus on consistently applying your analysis and strategies. Be patient with your progress and persistent in your efforts to expand your knowledge and improve your skills. By keeping these considerations in mind, you can effectively learn technical analysis and enhance your ability to make informed trading decisions.
Conclusion
In conclusion, technical analysis is a powerful tool that can help traders and investors make informed decisions in the complex world of financial markets. By focusing on the technical aspects of trading, such as price movements, volume, and chart patterns, technical analysis provides insights into market trends and potential trading opportunities. In contrast to fundamental analysis, which primarily focuses on a company's financial health and economic indicators, technical analysis examines past market data to forecast future trends. With the foundational knowledge provided in this article, traders and investors can begin to incorporate technical analysis into their investment strategies and gain a deeper understanding of market dynamics.
If you have made it this far, we truly appreciate your efforts and wish you nothing but success on your trading journey.
